
Quick Answer
Custom GA4 dashboard engineering solves native Google Analytics 4 reporting failures by routing raw event telemetry through Google Tag Manager, staging it inside BigQuery SQL data warehouses, and visualizing unified metrics in Looker Studio. This end-to-end architecture eliminates data sampling, bypasses Looker Studio API quota limits, cleans “Unassigned” traffic channels, and blends multi-channel ad spend (Meta, Google, TikTok) with true GA4 e-commerce revenue for real-time Return on Ad Spend (ROAS) clarity.
Key Takeaways
- Bypass Native GA4 Limitations: Standard GA4 UI suffers from thresholding, cardinality limits, missing spend data, and restrictive 14-month data retention.
- BigQuery SQL Data Warehouse: Streaming raw GA4 events into BigQuery provides complete data ownership, unlimited historical retention, and custom SQL data modeling.
- Multi-Channel Ad Spend Blending: Join ad spend from Google Ads, Meta Ads, and TikTok Ads directly with actual backend revenue to calculate true Return on Ad Spend (ROAS) and Marketing Efficiency Ratio (MER).
- Quota-Free Looker Studio Dashboards: Querying pre-aggregated BigQuery tables prevents Looker Studio API quota crashes (429 Too Many Requests).
- Privacy-First Compliance: Implementing Google Consent Mode V2 via Cookiebot ensures legal compliance while maintaining analytics continuity across European and global markets.
The Executive Analytics Crisis Why Default GA4 Reports Fail
A founder managing a $60,000 monthly multi-channel ad budget once reached out to me in distress. His marketing team was running scale campaigns across Meta Ads, Google Search, and TikTok. However, when opening the standard Google Analytics 4 interface, the reports showed over 40% of their total conversions falling under the dreaded “Unassigned” traffic channel. Furthermore, native GA4 purchase counts lagged behind Shopify order totals by nearly 25%, while Looker Studio reports failed constantly with red API quota limit errors.
This executive was wasting over 10 hours every week manually copying ad costs from three different ad managers into spreadsheets, desperately trying to calculate his true blended ROAS and Customer Acquisition Cost (CAC).
Standard Google Analytics 4 is built as an event collection tool, not an executive BI dashboard platform. Native reports apply strict thresholding, group high-cardinality dimensions into “Other”, and completely lack built-in cost-data integration for non-Google channels. Without dedicated GA4 dashboard engineer solutions, e-commerce brands and lead generation businesses operate on broken metrics, leading to misallocated ad budgets and incorrect scaling decisions.
Why Analytics Dashboard Engineering Matters
Relying on out-of-the-box analytics tools without custom data engineering creates hidden revenue leaks across your organization.
The Problem of Standard Implementations
- Data Sampling & Thresholding: Google hides rows containing small user counts to protect privacy, leaving critical conversion paths invisible.
- API Quota Lockouts: Direct Looker Studio connectors hit Google Analytics Data API limits, causing reports to crash during team presentations.
- Siloed Cost Data: Meta, TikTok, and LinkedIn spend live in separate ad accounts, forcing manual spreadsheet merging.
- Broken Traffic Attribution: Default web tag setups drop UTM parameters during cross-domain redirects or payment gateway roundtrips.
- Short Data Retention: Native GA4 user-level retention expires after 14 months, preventing year-over-year cohort analysis.
The Engineered Solution
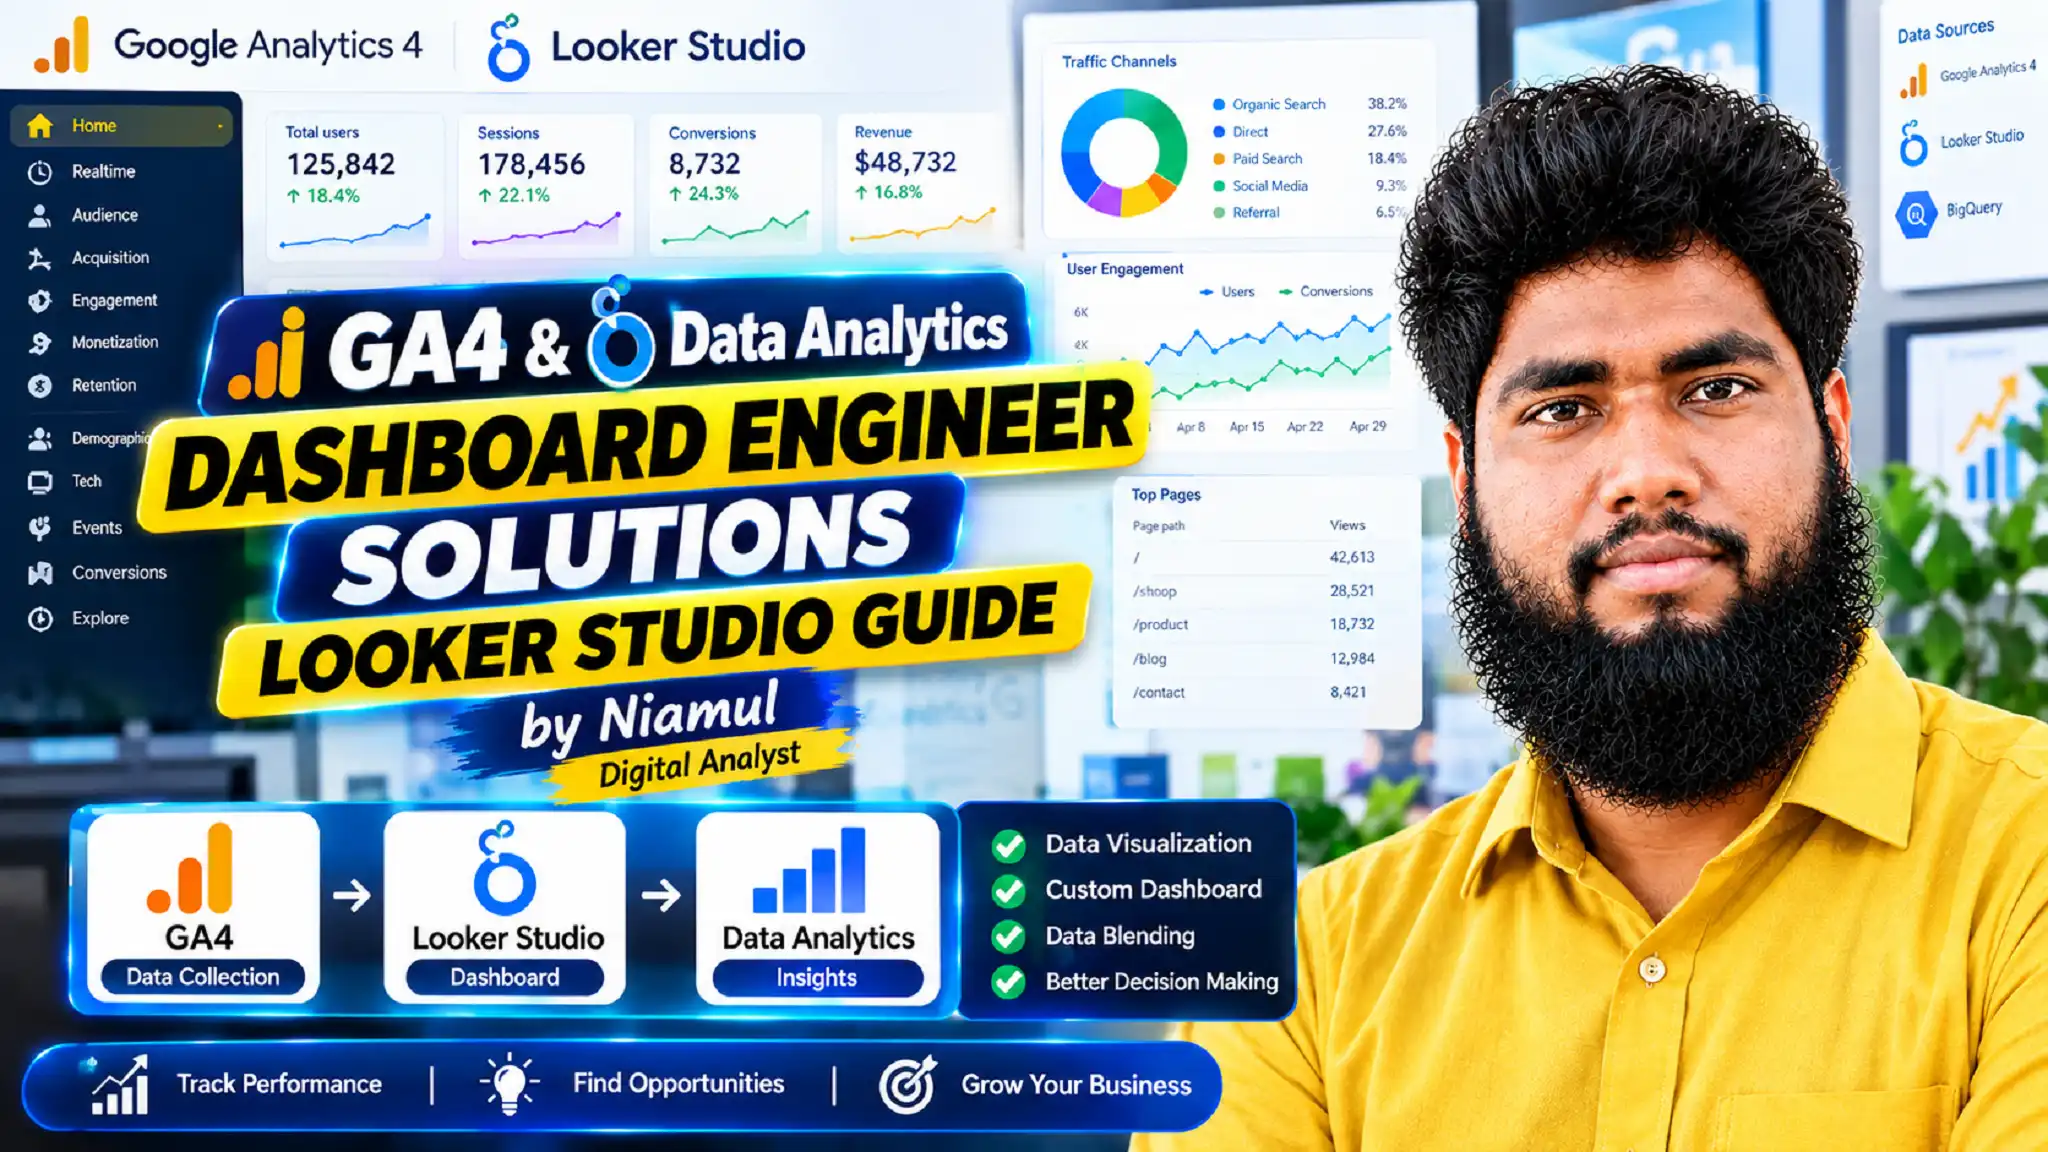
By engineering a dedicated analytics pipeline—leveraging Google Tag Manager for event extraction, BigQuery SQL for raw event transformation, and Looker Studio for executive visualization—you establish an automated, enterprise-grade data warehouse.
5 Core Benefits of Advanced Dashboard Engineering
- 100% Raw Data Ownership: Export every click, purchase, and user property into BigQuery without sampling or truncation.
- Automated Multi-Channel Attribution: Automatically blend Google Ads, Meta Ads, and TikTok Ads spend with clean GA4 purchase events.
- Instant Dashboard Load Times: Querying transformed BigQuery views reduces Looker Studio load times from minutes to milliseconds.
- Custom Business Logic: Define proprietary metrics such as Customer Lifetime Value (LTV), First-Time vs. Returning Customer ROAS, and Net Margin.
- Automated Stakeholder Reporting: Deliver real-time executive reports that auto-refresh without manual intervention.
Prerequisites & Technical Infrastructure Checklist
Before building an enterprise analytics pipeline, ensure you have the following access rights and system configurations ready:
- Google Analytics 4 Property: Administrator access with BigQuery Linking privileges enabled.
- Google Tag Manager Container: Admin rights on the Web container (and Server container for server-side implementations).
- Google Cloud Platform (GCP) Project: Active billing account with BigQuery API and IAM permissions enabled.
- Looker Studio Workspace: Workspace Creator permissions linked to your corporate Google account.
- Ad Account Access: API read access or automated connector permissions for Google Ads, Meta Ads, and TikTok Ads.
- Consent Management Platform: Cookiebot account configured for Google Consent Mode V2 compliance.
Video Guide Automated GA4 & Looker Studio Engineering
Watch my step-by-step video tutorial demonstrating how to clean raw event parameters, structure BigQuery SQL datasets, and build custom multi-channel dashboards in Looker Studio:
Step-by-Step Implementation: Building an Enterprise Analytics Pipeline
Follow this 5-phase data engineering guide to transform fragmented event telemetry into an automated performance dashboard.
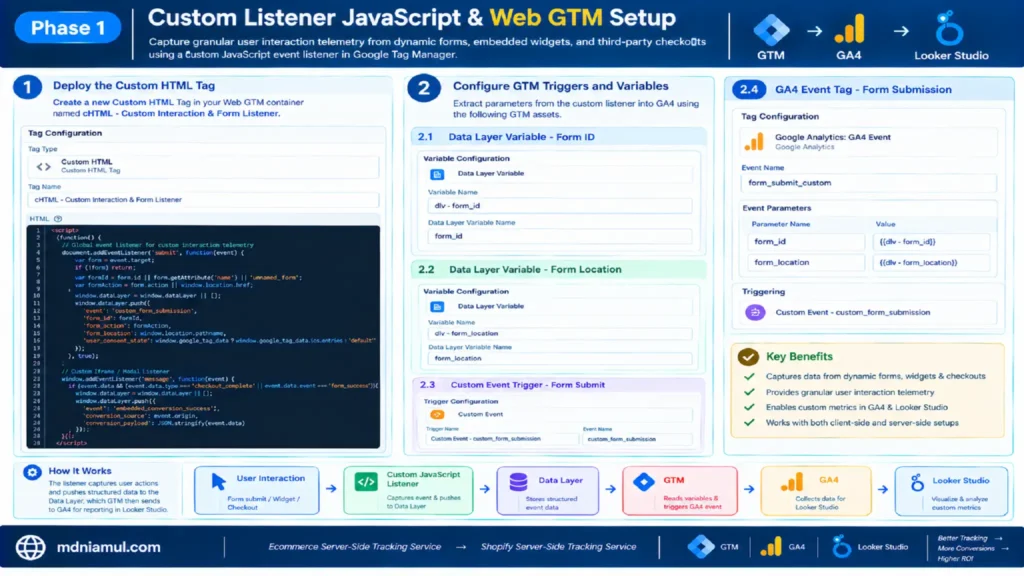
Phase 1: Custom Listener JavaScript & Web GTM Setup
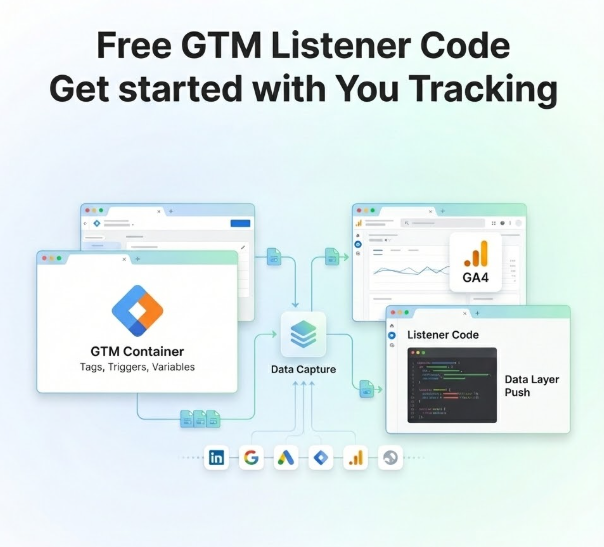
Standard browser triggers often miss interaction data from dynamic forms, embedded widgets, or third-party checkouts. To capture granular user interaction telemetry, deploy a custom JavaScript event listener in Google Tag Manager.
Step 1.1: Deploy the Universal Form & Interactive Listener Code
Create a new Custom HTML Tag in your Web GTM container named cHTML – Custom Interaction & Form Listener. Paste the following tested JavaScript code:
					<script>
(function() {
  // Global event listener for custom interaction telemetry
  document.addEventListener('submit', function(event) {
    var form = event.target;
    if (!form) return;

    var formId = form.id || form.getAttribute('name') || 'unnamed_form';
    var formAction = form.action || window.location.href;

    window.dataLayer = window.dataLayer || [];
    window.dataLayer.push({
      'event': 'custom_form_submission',
      'form_id': formId,
      'form_action': formAction,
      'form_location': window.location.pathname,
      'user_consent_state': window.google_tag_data ? window.google_tag_data.ics.entries : 'default'
    });
  }, true);

  // Custom Iframe / Modal Listener
  window.addEventListener('message', function(event) {
    if (event.data && (event.data.type === 'checkout_complete' || event.data.event === 'form_success')) {
      window.dataLayer = window.dataLayer || [];
      window.dataLayer.push({
        'event': 'embedded_conversion_success',
        'conversion_source': event.origin,
        'conversion_payload': JSON.stringify(event.data)
      });
    }
  });
})();
</script>
Step 1.2: Configure GTM Triggers and Variables
To extract parameters from this custom listener into GA4, set up the following GTM assets:
- Data Layer Variable – Form ID:
- Variable Name: dlv – form_id
- Data Layer Variable Name: form_id
- Data Layer Variable – Form Location:
- Variable Name: dlv – form_location
- Data Layer Variable Name: form_location
- Custom Event Trigger – Form Submit:
- Trigger Name: Custom Event – custom_form_submission
- Event Name: custom_form_submission
- GA4 Event Tag – Form Submission:
- Tag Type: Google Analytics: GA4 Event
- Event Name: form_submit_custom
- Event Parameters:
- form_id : {{dlv – form_id}}
- form_location : {{dlv – form_location}}
- Firing Trigger: Custom Event – custom_form_submission
For high-volume stores or server-side setups, explore our ecommerce server-side tracking service and shopify server side tracking service.
Phase 2: GA4 Custom Definitions & Schema Mapping
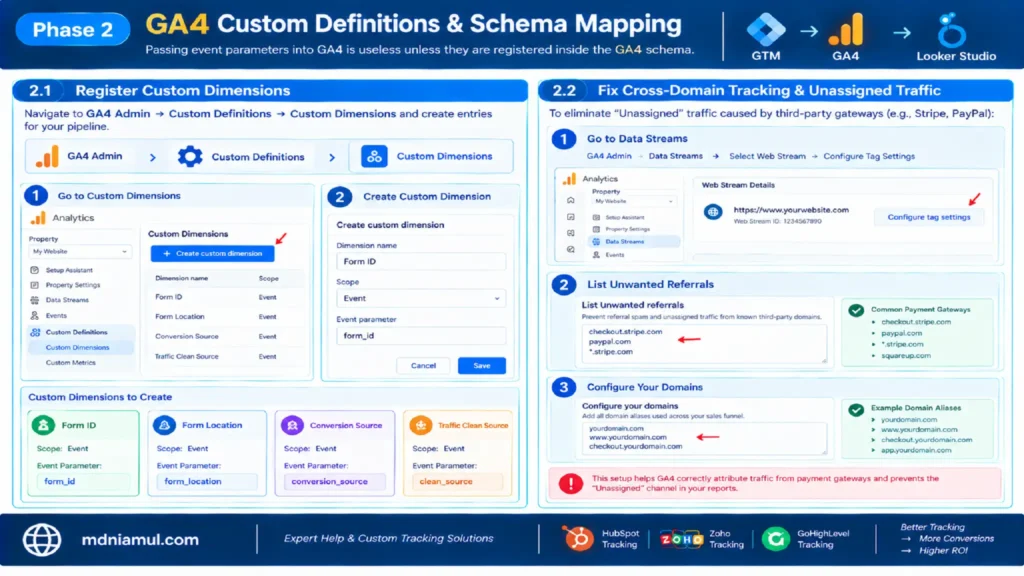
Passing event parameters into GA4 is useless unless they are registered inside the GA4 schema.
Step 2.1: Register Custom Dimensions
Navigate to GA4 Admin > Custom Definitions > Custom Dimensions and create entries for your pipeline:
- Dimension Name: Form ID | Scope: Event | Event Parameter: form_id
- Dimension Name: Form Location | Scope: Event | Event Parameter: form_location
- Dimension Name: Conversion Source | Scope: Event | Event Parameter: conversion_source
- Dimension Name: Traffic Clean Source | Scope: Event | Event Parameter: clean_source
Step 2.2: Fix Cross-Domain Tracking & Unassigned Traffic
To eliminate “Unassigned” traffic caused by third-party gateways (e.g., Stripe, PayPal):
- Go to GA4 Admin > Data Streams > Select Web Stream > Configure Tag Settings.
- Click List Unwanted Referrals and add your payment gateway domains (e.g., checkout.stripe.com, paypal.com).
- Click Configure Your Domains and add all domain aliases used across your sales funnel.
If you manage custom CRM forms, consult our specialized guides for hubspot form conversion tracking services, zoho form conversion tracking service, and gohighlevel form conversion tracking services.
Phase 3: BigQuery Export & SQL Data Modeling
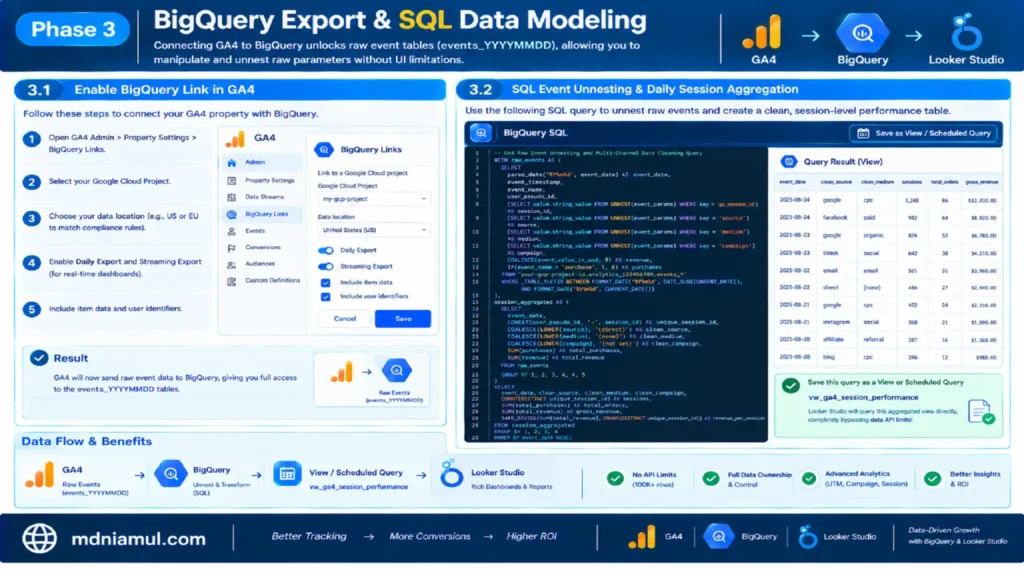
Connecting GA4 to BigQuery unlocks raw event tables (events_YYYYMMDD), allowing you to manipulate and unnest raw parameters without UI limitations.
Step 3.1: Enable BigQuery Link in GA4
- Open GA4 Admin > Property Settings > BigQuery Links.
- Select your Google Cloud Project.
- Choose your data location (e.g., US or EU to match compliance rules).
- Enable Daily Export and Streaming Export (for real-time dashboards).
- Include item data and user identifiers.
Step 3.2: SQL Event Unnesting & Daily Session Aggregation
Raw GA4 data stores parameters inside repeated record arrays (event_params). Use this optimized BigQuery SQL query to unnest raw events into clean, session-level performance tables:
					-- GA4 Raw Event Unnesting and Multi-Channel Data Cleaning Query
WITH raw_events AS (
  SELECT
    parse_date('%Y%m%d', event_date) AS event_date,
    event_timestamp,
    event_name,
    user_pseudo_id,
    (SELECT value.string_value FROM UNNEST(event_params) WHERE key = 'ga_session_id') AS session_id,
    (SELECT value.string_value FROM UNNEST(event_params) WHERE key = 'source') AS source,
    (SELECT value.string_value FROM UNNEST(event_params) WHERE key = 'medium') AS medium,
    (SELECT value.string_value FROM UNNEST(event_params) WHERE key = 'campaign') AS campaign,
    COALESCE(event_value_in_usd, 0) AS revenue,
    IF(event_name = 'purchase', 1, 0) AS purchases
  FROM
    `your-gcp-project-id.analytics_123456789.events_*`
  WHERE
    _TABLE_SUFFIX BETWEEN FORMAT_DATE('%Y%m%d', DATE_SUB(CURRENT_DATE(), INTERVAL 30 DAY))
    AND FORMAT_DATE('%Y%m%d', CURRENT_DATE())
),

session_aggregated AS (
  SELECT
    event_date,
    CONCAT(user_pseudo_id, '-', session_id) AS unique_session_id,
    COALESCE(LOWER(source), '(direct)') AS clean_source,
    COALESCE(LOWER(medium), '(none)') AS clean_medium,
    COALESCE(LOWER(campaign), '(not set)') AS clean_campaign,
    SUM(purchases) AS total_purchases,
    SUM(revenue) AS total_revenue
  FROM
    raw_events
  GROUP BY
    1, 2, 3, 4, 5
)

SELECT
  event_date,
  clean_source,
  clean_medium,
  clean_campaign,
  COUNT(DISTINCT unique_session_id) AS sessions,
  SUM(total_purchases) AS total_orders,
  SUM(total_revenue) AS gross_revenue,
  SAFE_DIVIDE(SUM(total_revenue), COUNT(DISTINCT unique_session_id)) AS revenue_per_session
FROM
  session_aggregated
GROUP BY
  1, 2, 3, 4
ORDER BY
  event_date DESC;
Save this SQL query as a Scheduled Query or View in BigQuery (vw_ga4_session_performance). Looker Studio will query this aggregated view directly, completely bypassing data API limits!
Phase 4: Multi-Channel Ad Data Blending in Looker Studio
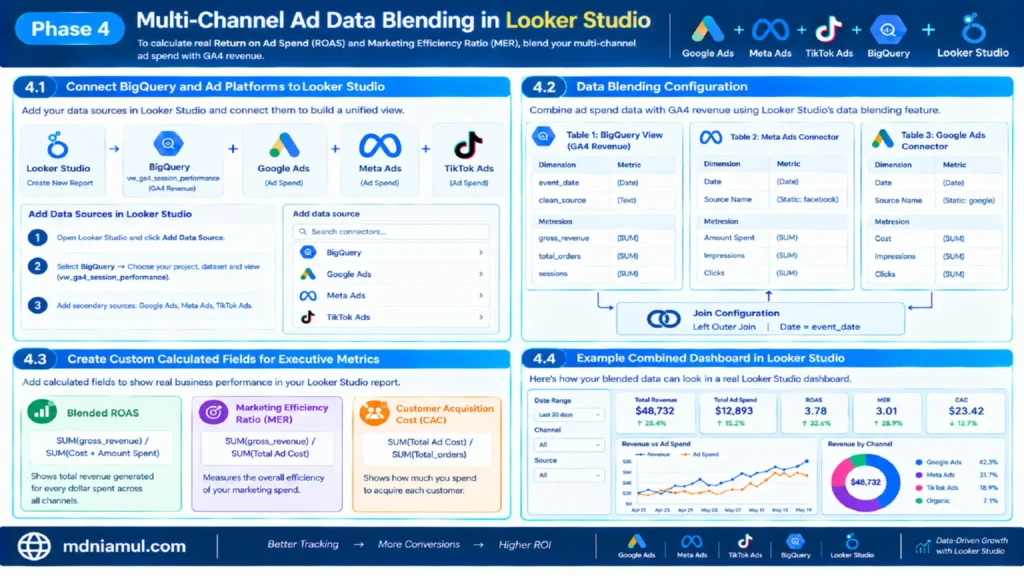
To calculate real Return on Ad Spend (ROAS) and Marketing Efficiency Ratio (MER), blend your multi-channel ad spend with GA4 revenue.
Step 4.1: Connect BigQuery and Ad Platforms to Looker Studio
- Open Looker Studio.
- Add Data Source > Select BigQuery > Choose your project, dataset, and vw_ga4_session_performance View.
- Add secondary data sources using native connectors or third-party pipelines for Google Ads, Meta Ads, and TikTok Ads.
Step 4.2: Data Blending Configuration
Create a Data Blend in Looker Studio to join ad spend with BigQuery revenue:
- Table 1 (BigQuery View):
- Dimensions: event_date, clean_source
- Metrics: gross_revenue, total_orders, sessions
- Table 2 (Meta Ads Connector):
- Dimensions: Date, Source Name (Static text: ‘facebook’)
- Metrics: Amount Spent, Impressions, Clicks
- Table 3 (Google Ads Connector):
- Dimensions: Date, Source Name (Static text: ‘google’)
- Metrics: Cost, Impressions, Clicks
- Join Configuration: Left Outer Join on Date = event_date.
Step 4.3: Create Custom Calculated Fields for Executive Metrics
Add custom calculated fields in Looker Studio to display real business performance:
- Blended ROAS:
- Formula: SUM(gross_revenue) / SUM(Cost + Amount Spent)
- Marketing Efficiency Ratio (MER):
- Formula: SUM(gross_revenue) / SUM(Total Ad Cost)
- Customer Acquisition Cost (CAC):
- Formula: SUM(Total Ad Cost) / SUM(total_orders)
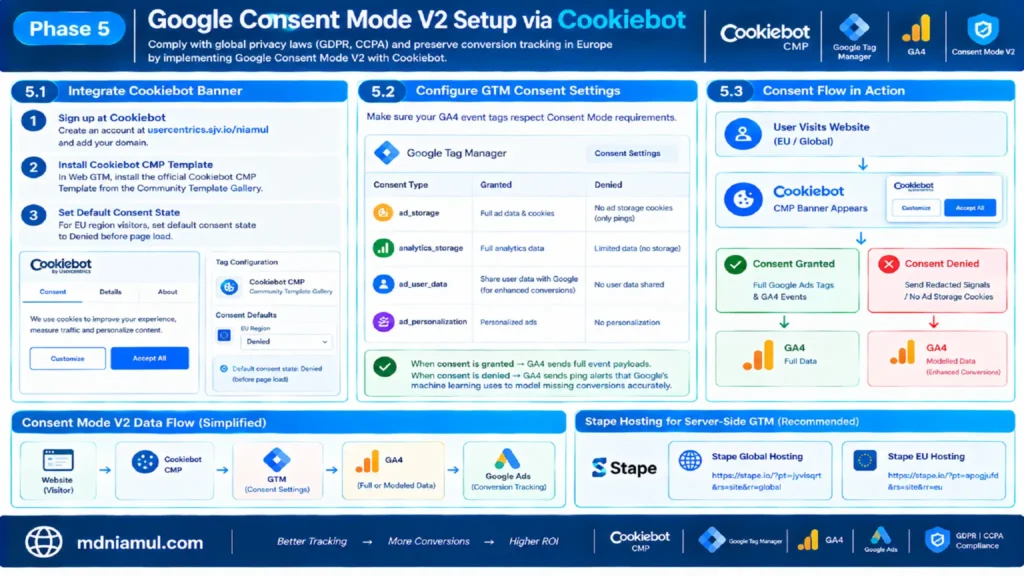
Phase 5: Google Consent Mode V2 Setup via Cookiebot
To comply with global privacy laws (GDPR, CCPA) and preserve conversion tracking in Europe, implement Google Consent Mode V2.
Step 5.1: Integrate Cookiebot Banner
- Sign up at Cookiebot and add your domain.
- In Web GTM, install the official Cookiebot CMP Template from the Community Template Gallery.
- Set default consent state to Denied for EU region visitors before page load.
Step 5.2: Configure GTM Consent Settings
Ensure your GA4 event tags reflect Consent Mode requirements:
- ad_storage: Granted / Denied
- analytics_storage: Granted / Denied
- ad_user_data: Granted / Denied
- ad_personalization: Granted / Denied
When consent is granted, GA4 sends full event payloads. When denied, GA4 sends ping alerts that Google’s machine learning uses to model missing conversions accurately.
Need dedicated server hosting for server-side GTM containers? Review our Stape Global hosting and Stape EU hosting referral options.
Complete Data Architecture Blueprint
Here is the complete structural architecture for an enterprise analytics deployment:
1. Data Collection Layer
- Tools: Google Tag Manager (Web + Server-Side), Custom JavaScript Event Listeners, Data Layer API.
- Function: Captures user interactions, order telemetry, client identifiers, and Consent Mode V2 states.
- Target Destination: GA4 Measurement Protocol, Meta Conversions API, Google Ads API.
2. Data Warehousing & Transformation Layer
- Tools: Google Cloud Platform, BigQuery SQL Engine, GCP Scheduled Queries.
- Function: Unnests raw event JSON arrays, removes duplicate transaction IDs, attributes session channels, and stores historical records permanently.
- Target Destination: BigQuery SQL Reporting Views.
3. Visualization & BI Layer
- Tools: Looker Studio, Looker Studio Pro.
- Function: Visualizes multi-channel ad spend, calculates MER/ROAS metrics, and provides real-time executive performance views.
- Stakeholders: Chief Marketing Officers (CMOs), Founders, E-commerce Managers, Paid Media Specialists.
Testing & Validation Workflow
Never launch a custom dashboard without rigorous verification across all layers of the data stack.
1. Web GTM & Event Tag Validation
- Launch GTM Preview Mode and navigate through your sales funnel.
- Verify that custom listener events (custom_form_submission, purchase) trigger correctly.
- Inspect variables to ensure user data and transactional parameters load without errors.
2. GA4 DebugView Audit
- Open GA4 > Admin > DebugView.
- Perform test actions on your website.
- Verify that incoming events display custom parameters (form_id, conversion_source) without schema mismatches.
3. BigQuery SQL Query Dry Run
- In the BigQuery Console, execute your modeling SQL query using the Dry Run feature.
- Verify query cost estimates and check that total row counts match GA4 event totals.
- Confirm that null or (not set) values are properly handled by COALESCE functions.
4. Looker Studio Field Audit
- Compare total revenue and transaction figures in Looker Studio against your backend CRM or e-commerce platform (Shopify, WooCommerce, Stripe).
- Confirm that cross-channel date filters match across blended tables.
Troubleshooting Common Dashboard Engineering Errors
Problem 1: Looker Studio Throws “Data Set Configuration Error” or API Quota Limits
- Cause: Connecting Looker Studio directly to GA4 hits Google Analytics Data API token limits (429 Too Many Requests).
- Solution: Disconnect direct GA4 connectors. Stream GA4 data into BigQuery and connect Looker Studio to the pre-aggregated BigQuery view instead.
Problem 2: High Volume of Traffic Categorized as “Unassigned”
- Cause: Missing UTM parameters, broken cross-domain tracking, or unlisted payment processor referral domains.
- Solution: Add payment gateways (e.g., checkout.stripe.com) to GA4 Referral Exclusions. Ensure all paid ad URLs contain clean utm_source, utm_medium, and utm_campaign tagging.
Problem 3: BigQuery SQL Query Fails with “Cannot Array Unnest Null”
- Cause: Attempting to unnest event_params on rows where parameters do not exist.
- Solution: Use LEFT JOIN UNNEST(event_params) or scalar subqueries with COALESCE(value.string_value, ‘default’) to handle null parameters safely.
Problem 4: Discrepancy Between Ad Platform Spend and Dashboard Totals
- Cause: Time zone mismatches between ad account settings (e.g., EST) and BigQuery dataset settings (e.g., UTC).
- Solution: Standardize time zones across Google Ads, Meta Ads, GA4, and BigQuery using TIMESTAMP_CONVERT functions in SQL.
Conclusion Achieve Total Analytics Clarity
Standard, out-of-the-box analytics tools no longer suffice for competitive, multi-channel marketing campaigns. By engineering a custom data pipeline using Google Tag Manager, GA4 event schema design, BigQuery SQL data modeling, and Looker Studio visualization, you eliminate reporting guesswork. You gain total data ownership, reliable cross-channel attribution, and executive dashboards that drive profitable scaling decisions.
Whether you need to resolve broken conversion tracking, connect custom CRMs, or deploy enterprise server-side pipelines, custom data engineering turns chaotic data into your greatest competitive advantage.
Summary by MD Niamul
This comprehensive guide details how to engineer custom GA4 and Looker Studio analytics solutions to overcome native reporting gaps. By capturing event telemetry via custom GTM listeners, storing raw events in BigQuery SQL data warehouses, and visualizing unified metrics in Looker Studio, organizations unlock real-time multi-channel attribution, quota-free dashboards, and true blended ROAS clarity. It also covers Google Consent Mode V2 setup via Cookiebot, troubleshooting workflows, and data verification steps.
1.What is GA4 dashboard engineer solutions?
GA4 dashboard engineer solutions involve designing custom analytics pipelines that extract raw event data via Google Tag Manager, transform parameters using BigQuery SQL data modeling, and present clean performance metrics inside Looker Studio. This process eliminates native GA4 limitations like sampling, thresholding, missing cost data, and API quota limits.
2.Why avoid standard GA4 native reports?
Native GA4 reports apply aggressive data sampling, enforce thresholding on user demographics, limit historical data retention to 14 months, and group unmapped traffic into “Unassigned”. Moreover, standard GA4 reports cannot blend ad spend from non-Google channels like Meta or TikTok to show real-time blended ROAS.
3.How does BigQuery improve Looker Studio?
BigQuery acts as an enterprise data warehouse that stores raw, unnested GA4 event records without sampling. By writing SQL queries that aggregate session metrics daily into views, Looker Studio connects directly to BigQuery. This completely bypasses Looker Studio API quota limits and delivers instantaneous dashboard loading speeds.
4.Can we track multi-channel ad spend?
Yes. By pulling ad spend metrics from Meta Ads, Google Ads, and TikTok Ads into BigQuery or Looker Studio data blends, you can join cost metrics with clean GA4 e-commerce revenue on matching date dimensions. This allows you to calculate accurate Blended ROAS and Marketing Efficiency Ratios (MER).
5.What is Google Consent Mode V2?
Google Consent Mode V2 is a privacy framework that adjusts how Google tags behave based on visitor consent preferences. Integrated with Consent Management Platforms like Cookiebot, it sends cookieless pings when consent is denied, allowing Google machine learning to model lost conversion data legally.
6.How do custom JavaScript listeners work?
Custom JavaScript listeners monitor DOM events on your website, such as iframe messages, dynamic form submissions, or AJAX requests. When an interaction occurs, the listener pushes structured event payloads into the GTM Data Layer, enabling precise conversion tracking for complex forms and checkouts.
7.Why does traffic appear as Unassigned?
Traffic is classified as “Unassigned” when incoming visitors lack proper UTM parameters, or when cross-domain redirects strip referrer headers. Unwanted referrals from payment gateways (like Stripe or PayPal) can also split sessions, causing traffic to lose its original traffic source attribution.
8.What is Marketing Efficiency Ratio MER?
Marketing Efficiency Ratio (MER) is calculated by dividing total gross revenue by total marketing spend across all advertising channels. Unlike single-channel ROAS, MER provides an executive-level view of overall marketing health and profitability, preventing over-reliance on platform-specific attribution claims.
9.Is server-side tracking required for dashboards?
While not strictly mandatory, server-side tracking via Server GTM significantly enhances dashboard data accuracy. It bypasses ad blockers, extends browser cookie lifetimes, mitigates iOS privacy restrictions, and ensures that clean, un-tampered event data reaches BigQuery and GA4.
10.How long does dashboard engineering take?
A custom GA4, BigQuery, and Looker Studio data engineering setup typically takes between 3 to 7 business days. This timeframe covers GTM tag auditing, custom event listener deployment, BigQuery dataset setup, SQL data transformation modeling, Looker Studio UI design, and rigorous validation.
 Need Help Advanced GHL Automation & Tracking Setup?