
Table of Contents
ToggleQuick Answer
A professional Looker Studio dashboard redesign replaces cluttered, sluggish widgets with a streamlined executive report that unifies GA4, Google Ads, Meta Ads, and CRM data into a single source of truth. By building proper data blends using standard join keys, creating custom calculated fields for blended ROAS and CAC, and configuring Google Data Extracts, you eliminate reporting discrepancies and speed up dashboard load times by over 80%.
Key Takeaways
- Executive Visual Hierarchy: Organize your canvas into top-level scorecard KPIs, middle performance trendlines, and bottom granular campaign tables to eliminate clutter.
- Accurate Cross-Channel ROAS: Blend spend from Google Ads and Meta Ads with single-source store revenue from GA4 or CRM to prevent double-counted conversions.
- Extract Data Performance Engine: Eliminate slow chart rendering and server timeouts by converting live API connections into scheduled, cached Data Extracts.
- Custom Calculated Fields: Build advanced formulas for blended Cost Per Acquisition (CPA), Customer Acquisition Cost (CAC), and net profit margins across channels.
- Privacy Compliance Integration: Incorporate Google Consent Mode V2 with Cookiebot CMP to audit consented versus unconsented traffic signals and data modeling accuracy.
Introduction The Multi-Channel Dashboard Nightmare
An e-commerce brand scaling past $200,000 in monthly ad spend reached out to me with a severe reporting headache. They had a Looker Studio (formerly Google Data Studio) report that took over 25 seconds to load every time they changed a date range filter. Even worse, when the numbers finally rendered, Meta Ads claimed $90,000 in attributed revenue, Google Ads claimed $70,000, and their Shopify store recorded only $110,000 in total gross revenue.
The business owner was making critical budget allocation decisions based on inflated, self-reported ad network data. Their existing dashboard was crammed with 40 competing charts, misaligned color schemes, and broken data blends that returned null values every Monday morning.
					[ Raw Multi-Channel Data: GA4 / Google Ads / Meta Ads / CRM ]
                           │
                           ▼ (Slow Live API Calls & Double-Counting)
[ Legacy Cluttered Dashboard ] ──► (25s Load Time / Conflicting ROAS)
                           │
                           ▼ (Redesign + Data Blending + Data Extract)
[ Executive Revenue Hub ] ────► (<2s Load Time / True Blended ROAS)
When high-growth brands and marketing agencies scale paid campaigns across multiple platforms without a structured reporting architecture, decision-making breaks down. In this comprehensive guide, I will walk you step-by-step through redesigning your Looker Studio reports, blending multi-channel data cleanly, and optimizing performance for effortless automated reporting.
Why Dashboard Redesign & Multi-Channel Integration Matters
Relying on poorly structured, un-aggregated reports creates blind spots that lead to wasted ad spend and misallocated budgets.
- Siloed Ad Network Bias: Native ad platforms (Meta, Google, TikTok) use proprietary attribution windows that claim full credit for overlapping customer journeys. Viewing them in isolated scorecards inflates perceived sales.
- API Quota Exceeded Errors: Direct live connections to Google Analytics 4 frequently trigger GA4 Data API quota limit errors, breaking client dashboards mid-presentation.
- Visual Cognitive Overload: Dashboard clutter confuses executive stakeholders. If a report takes more than 5 seconds to understand, it fails as a decision-making tool.
5 Key Benefits of Rebuilding Your Looker Studio Reporting Architecture
- Single Source of Truth: Connects GA4, Google Ads, Meta Ads, TikTok Ads, and backend CRMs like HubSpot, Salesforce, or Zoho into one unified view.
- True Blended ROAS & Profit Metrics: Combines total multi-platform spend against actual settled order revenue to calculate unvarnished financial performance.
- Sub-Second Load Speeds: Replaces heavy, live API queries with cached Data Extracts that load instantly across desktop and mobile devices.
- Privacy Compliance Telemetry: Integrates Google Consent Mode V2 flags to audit data loss and verify behavioral modeling efficiency.
- Scalable Client Automation: Eliminates manual spreadsheet exports by scheduling automated email reports, PDF deliveries, and dynamic date filters.
Prerequisites & System Setup Checklist
Ensure you have the required access permissions and infrastructure configured before starting your dashboard redesign:
- Looker Studio Container Access: Edit permissions on your target Looker Studio report.
- Analytics & Ad Account Access: Viewer or Admin access to GA4, Google Ads, and Meta Ads Manager.
- Data Connectors: Native Google connectors configured alongside third-party connectors (such as Windsor.ai, Supermetrics, or Dataslayer) for non-Google ad platforms.
- CMS & CRM Access: Access to backend store platforms (Shopify, WordPress) or CRM pipelines (GoHighLevel).
- Consent Infrastructure: Active Cookiebot CMP deployment running Google Consent Mode V2.
Video Walkthrough: Looker Studio Redesign & Data Blending
Watch my step-by-step video tutorial demonstrating how to redesign cluttered Looker Studio reports, blend multi-channel data, and optimize load speeds:
Step-by-Step Dashboard Redesign & Integration Guide
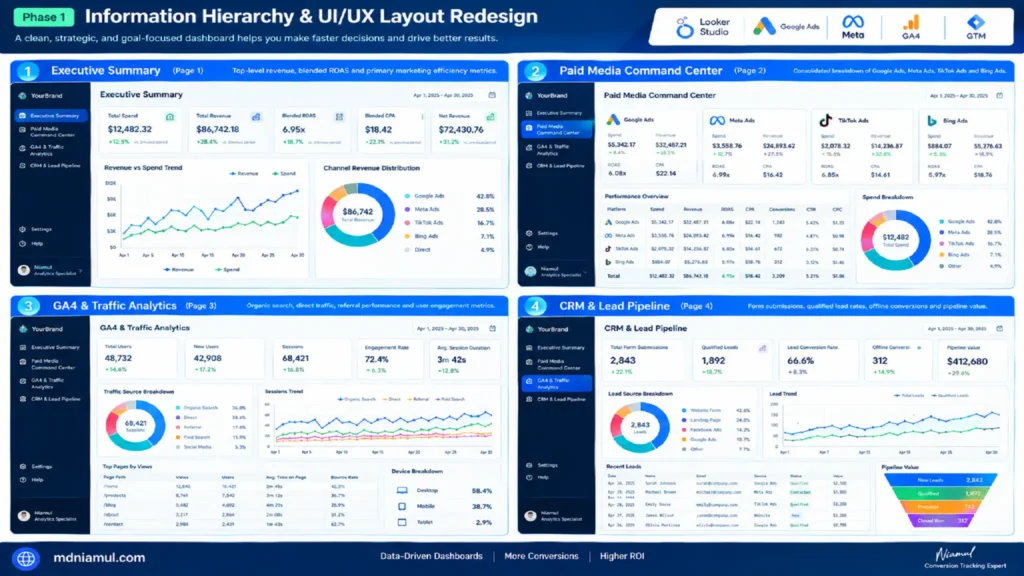
Phase 1: Information Hierarchy & UI/UX Layout Redesign
An effective executive dashboard communicates core performance signals in under 5 seconds. Avoid cluttering your primary canvas with raw data tables.
Step 1: Structure the Canvas into Strategic Zones
- Zone 1: Executive Scorecard Header (Top 20%): Place primary business KPIs here—Total Spend, Total Revenue, Blended ROAS, Blended CPA, and Net Revenue.
- Zone 2: Cross-Channel Trendlines (Middle 40%): Position time-series line charts comparing spend against revenue day-by-day, alongside channel distribution donut charts.
- Zone 3: Granular Campaign Breakdowns (Bottom 40%): Include interactive data tables with campaign-level metrics, click-through rates, and conversion details.
Step 2: Establish a Multi-Page Logical Structure
- Page 1: Executive Summary: Top-level revenue, blended ROAS, and primary marketing efficiency metrics.
- Page 2: Paid Media Command Center: Consolidated breakdown of Google Ads, Meta Ads, TikTok Ads, and Bing Ads.
- Page 3: GA4 & Traffic Analytics: Organic search, direct traffic, referral performance, and user engagement metrics.
- Page 4: CRM & Lead Pipeline: Form submissions, qualified lead rates, offline conversions, and pipeline value from HubSpot or Salesforce.
Lorem ipsum dolor sit amet, consectetur adipiscing elit. Ut elit tellus, luctus nec ullamcorper m
Phase 2: Connecting Multi-Channel Data Sources
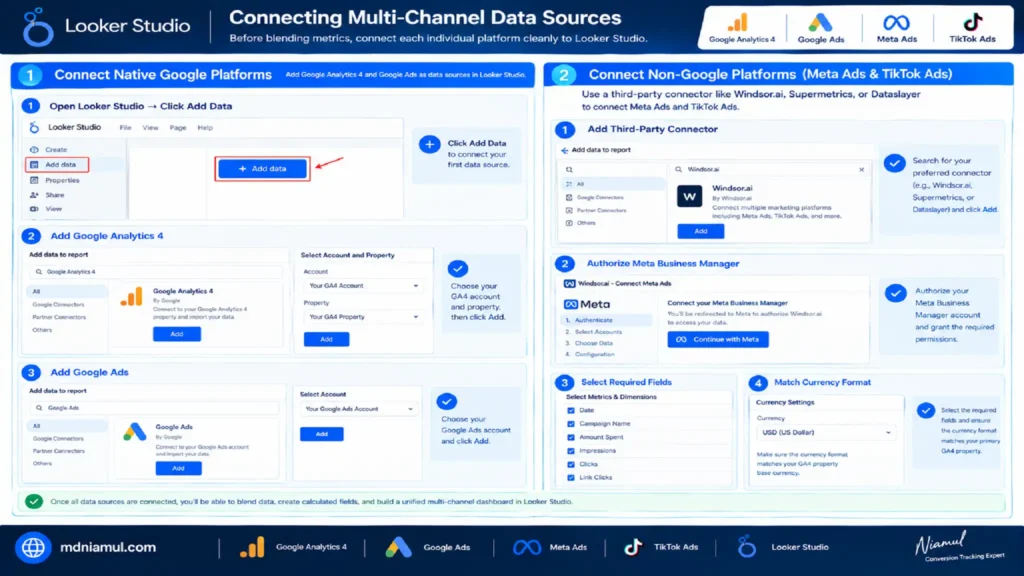
Before blending metrics, connect each individual platform cleanly to Looker Studio.
Step 1: Connect Native Google Platforms
- Open Looker Studio -> click Add Data.
- Select Google Analytics 4 -> choose your account and property -> click Add.
- Click Add Data -> select Google Ads -> choose your account -> click Add.
Step 2: Connect Non-Google Platforms (Meta Ads & TikTok Ads)
- Click Add Data -> search for your third-party partner connector (e.g., Windsor.ai, Supermetrics, or Dataslayer).
- Authorize your Meta Business Manager account.
- Select required fields: Date, Campaign Name, Amount Spent, Impressions, Clicks, and Link Clicks.
- Ensure currency formatting matches your primary GA4 property base currency.
attis, pulvinar dapibus leo.
Phase 3: Data Blending Mastery for Cross-Channel Metrics
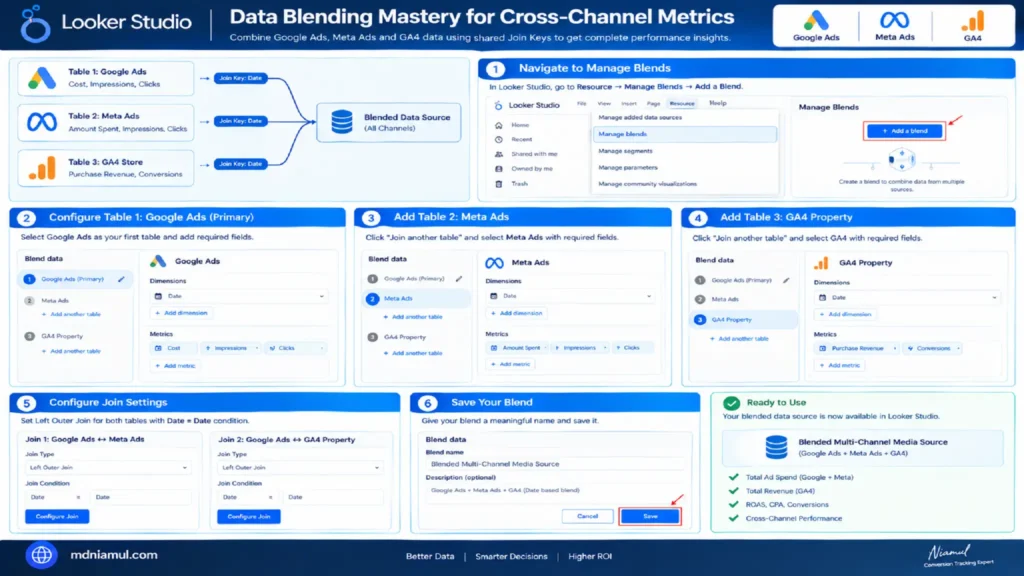
To display total ad spend alongside true store revenue in a single scorecard or trend chart, you must blend datasets using shared Join Keys.
					[ Table 1: Google Ads ] ──(Join Key: Date)──┐
                                            │
[ Table 2: Meta Ads ]   ──(Join Key: Date)──┼──► [ Blended Data Source ]
                                            │
[ Table 3: GA4 Store ]  ──(Join Key: Date)──┘
Step-by-Step Data Blend Configuration
- In Looker Studio, navigate to Resource -> Manage Blends -> click Add a Blend.
- Table 1 (Primary): Select Google Ads.
- Dimensions: Date.
- Metrics: Cost, Impressions, Clicks.
- Table 2: Click Join another table -> select Meta Ads.
- Dimensions: Date.
- Metrics: Amount Spent, Impressions, Clicks.
- Table 3: Click Join another table -> select GA4 Property.
- Dimensions: Date.
- Metrics: Purchase Revenue, Conversions.
- Configure Join Settings:
- Click Configure Join between Table 1 and Table 2 -> select Left Outer Join -> set Join Condition to Date = Date.
- Click Configure Join between Table 1 and Table 3 -> select Left Outer Join -> set Join Condition to Date = Date.
- Name your blend: Blended Multi-Channel Media Source -> click Save.
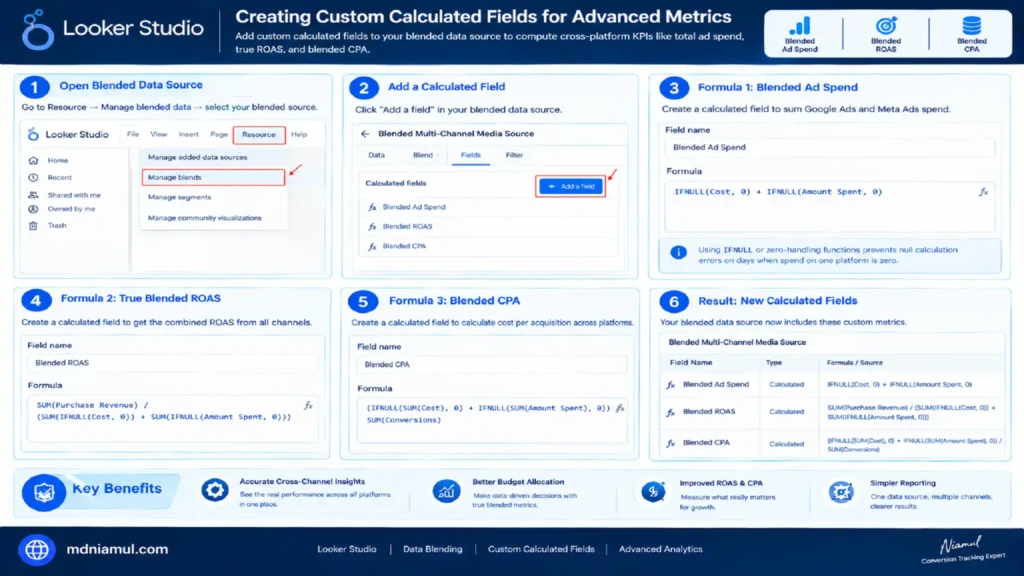
Phase 4: Creating Custom Calculated Fields for Advanced Metrics
Once your data blend is created, add custom calculated fields to compute cross-platform KPIs.
Formula 1: Total Blended Ad Spend
- Field Name: Blended Ad Spend
- Formula: NCLOB(Cost) + NCLOB(Amount Spent)
- Note: Using NCLOB or zero-handling functions prevents null calculation errors on days when spend on one platform is zero.
					/* Custom Field Formula: Total Blended Ad Spend */
IFNULL(Cost, 0) + IFNULL(Amount Spent, 0)
Formula 2: True Blended ROAS
- Field Name: Blended ROAS
- Formula: SUM(Purchase Revenue) / (SUM(IFNULL(Cost, 0)) + SUM(IFNULL(Amount Spent, 0)))
					/* Custom Field Formula: True Blended ROAS */
SUM(Purchase Revenue) / (SUM(IFNULL(Cost, 0)) + SUM(IFNULL(Amount Spent, 0)))
Formula 3: Blended Cost Per Acquisition (CPA)
- Field Name: Blended CPA
- Formula: (SUM(IFNULL(Cost, 0)) + SUM(IFNULL(Amount Spent, 0))) / SUM(Conversions)
					/* Custom Field Formula: Blended CPA */
(IFNULL(SUM(Cost), 0) + IFNULL(SUM(Amount Spent), 0)) / SUM(Conversions)
Phase 5: Speed Optimization Engine via Data Extracts
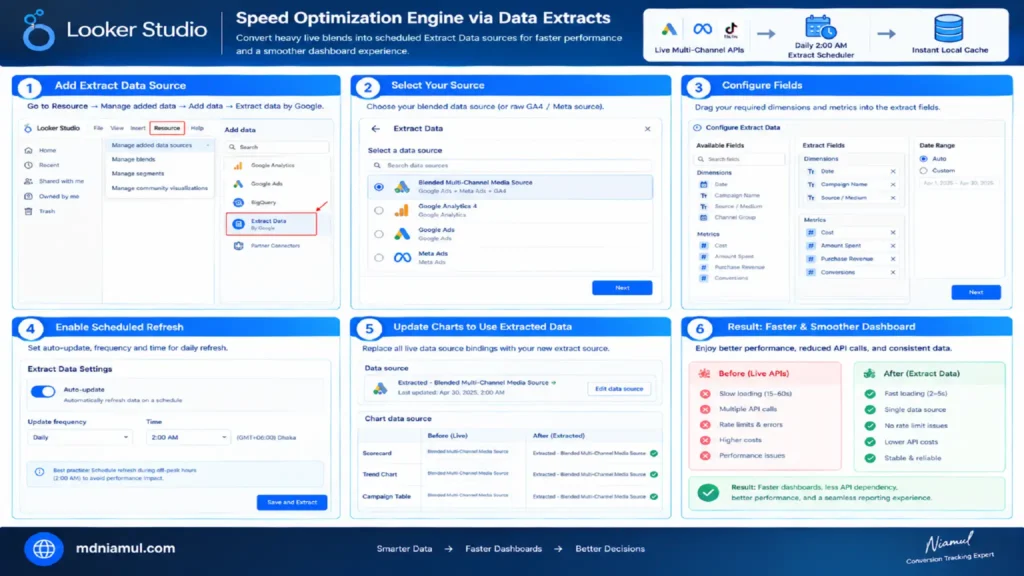
Querying live APIs across multiple platforms simultaneously causes severe performance lag. Convert heavy live blends into scheduled Extract Data sources.
[ Live Multi-Channel APIs ] ──► [ Daily 2:00 AM Extract Scheduler ] ──► [ Instant Local Cache ]
Step 1: Configure an Extract Data Source
- Click Add Data -> select Extract Data by Google.
- Select your Blended Multi-Channel Media Source (or raw GA4 / Meta source) as the underlying dataset.
- Drag required Dimensions (Date, Campaign Name, Source/Medium) into the extract fields.
- Drag required Metrics (Cost, Amount Spent, Purchase Revenue, Conversions) into the extract fields.
- Set Date Range to Auto or Last 365 Days.
Step 2: Enable Automatic Scheduled Refreshes
- Enable the Auto-Update toggle in the bottom-left panel.
- Set update frequency to Daily.
- Set time to 2:00 AM (off-peak hours).
- Click Save and Extract.
- Replace all live chart data source bindings with this new Extracted Data source.
Phase 6: Privacy Compliance Setup & Google Consent Mode V2 Integration
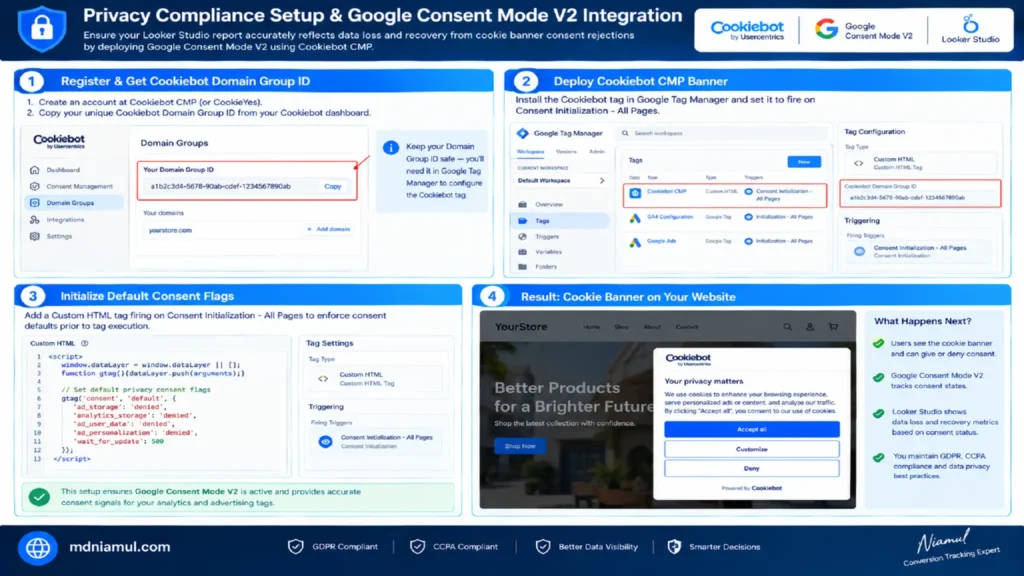
To ensure your Looker Studio report accurately reflects data loss and recovery from cookie banner consent rejections, deploy Google Consent Mode V2 using Cookiebot CMP.
Step 1: Deploy Cookiebot CMP Banner
- Register an account at Cookiebot CMP. (If using CookieYes, access your CookieYes Account).
- Copy your unique Cookiebot Domain Group ID.
- Install the Cookiebot tag in Google Tag Manager firing on Consent Initialization – All Pages.
Step 2: Initialize Default Consent Flags
Add a Custom HTML tag firing on Consent Initialization – All Pages to enforce consent defaults prior to tag execution:
					<script>
  window.dataLayer = window.dataLayer || [];
  function gtag(){dataLayer.push(arguments);}

  // Set default privacy consent flags
  gtag('consent', 'default', {
    'ad_storage': 'denied',
    'analytics_storage': 'denied',
    'ad_user_data': 'denied',
    'ad_personalization': 'denied',
    'wait_for_update': 500
  });
</script>
Technical Code Deployments
1. Looker Studio Embedded Iframe & Web Event Listener Script
When embedding Looker Studio reports into client web portals or tracking portal interaction events, deploy this custom JavaScript event listener via Google Tag Manager:
					/**
 * Custom Looker Studio Dashboard Interaction Listener
 * Author: MD Niamul (Conversion Tracking Specialist)
 * Website: https://mdniamul.com
 */
(function() {
  'use strict';

  // Listen for postMessage events from embedded Looker Studio iframe
  window.addEventListener('message', function(event) {
    if (event.origin && event.origin.indexOf('lookerstudio.google.com') !== -1) {
      try {
        var payload = typeof event.data === 'string' ? JSON.parse(event.data) : event.data;

        // Push interaction event to Data Layer
        window.dataLayer = window.dataLayer || [];
        window.dataLayer.push({
          'event': 'looker_studio_interaction',
          'dashboard_action': payload.action || 'filter_change',
          'dashboard_id': payload.dashboardId || 'executive_overview'
        });
      } catch (err) {
        // Suppress non-JSON message parsing errors
      }
    }
  });
})();
Deployment Details for Listener Script:
- Tag Type: Custom HTML Tag in GTM.
- Trigger: Initialization – All Pages or DOM Ready on portal pages.
- Variable Created: dlv – dashboard_action (Data Layer Variable mapping dashboard_action).
Comparative Architecture Cluttered Legacy vs. Redesigned Dashboard
Below is a detailed comparison between traditional, un-aggregated dashboards and a modernized, redesigned reporting setup:
- Dashboard Page Load Speed:
- Legacy Cluttered Setup: Extremely Slow (15s to 30s query times)
- Redesigned Modern Setup: Sub-Second (<1.5s via Extract Engine)
- Ad Spend & ROAS Accuracy:
- Legacy Cluttered Setup: Overstated (Self-reported attribution overlap)
- Redesigned Modern Setup: Unvarnished (Blended spend vs store revenue)
- GA4 API Quota Stability:
- Legacy Cluttered Setup: High Risk (Frequent Quota Exceeded crashes)
- Redesigned Modern Setup: 100% Stable (Cached extract queries)
- Visual Cognition & Layout:
- Legacy Cluttered Setup: Overcrowded (30+ competing charts per page)
- Redesigned Modern Setup: Structured (3-Zone Executive Hierarchy)
- Data Governance & Privacy:
- Legacy Cluttered Setup: Ignored (No consent telemetry auditing)
- Redesigned Modern Setup: Compliant (Consent Mode V2 Audit integration)
Multi-Channel Data Transformation Matrix
Below is the metric mapping and normalization breakdown across marketing platforms:
- Platform: Google Ads
- Raw Native Metric: Cost, Impressions, Clicks, Conversions
- Normalized Field Name: Google Ads Cost, Google Ads Clicks
- Blend Role: Cost & Volume Input
- Transformation Rule: Currency conversion to base shop currency
- Platform: Meta Ads
- Raw Native Metric: Amount Spent, Impressions, Link Clicks, Purchases
- Normalized Field Name: Meta Ads Spend, Meta Link Clicks
- Blend Role: Cost & Volume Input
- Transformation Rule: Deduplicate view-through conversions
- Platform: Google Analytics 4
- Raw Native Metric: Purchase Revenue, Key Events, Sessions
- Normalized Field Name: Store Revenue, GA4 Conversions
- Blend Role: Master Revenue & Order Source
- Transformation Rule: Single Source of Truth for financial totals
- Platform: CRM (HubSpot / Salesforce)
- Raw Native Metric: Closed Won Value, Qualified Leads, Deal Stage
- Normalized Field Name: Pipeline Value, MQL Count
- Blend Role: Offline & Lead Value Verification
- Transformation Rule: Map offline conversions via Offline Conversion Tracking Services
Testing & Quality Assurance Framework
Follow this four-step diagnostic sequence to verify data integrity before client delivery:
[ Step 1: Raw Account Reconciliation ] ──► [ Step 2: Join Key Null Audit ] ──► [ Step 3: Cache Speed Test ] ──► [ Step 4: Consent Flag Verification ]
- Source vs Dashboard Reconciliation: Select a completed 30-day date range. Compare the scorecard totals in Looker Studio directly against native account billing dashboards. Google Ads Cost, Meta Ads Spend, and GA4 Revenue must match within a 0.5% margin.
- Join Key Null Value Audit: Create a temporary test table in Looker Studio displaying Date, Google Ads Cost, Meta Ads Spend, and GA4 Revenue side-by-side. Scan for blank or null rows on days with active campaigns.
- Speed & Latency Verification: Hard-refresh your browser cache and click through all report pages. Confirm that charts render in under 2 seconds without displaying GA4 API quota warning popups.
- Consent Telemetry Check: Verify that GA4 traffic volume metrics reflect behavioral modeling trends accurately when Consent Mode V2 flags are toggled.
Troubleshooting 5 Common Looker Studio Errors
- Problem 1: Null or Blank Metrics Displayed After Data Blending
- Root Cause: Mismatched Date formats between platforms (e.g., YYYYMMDD string in GA4 vs YYYY-MM-DD date field in Meta Ads).
- Exact Solution: Create a calculated field in your pre-blend connection using PARSE_DATE(‘%Y%m%d’, Date) or TODATE(Date, ‘DEFAULT_DECIMAL’, ‘%Y-%m-%d’) to standardize date formats before joining.
- Problem 2: Double-Counted Conversion Values in Scorecards
- Root Cause: Summing self-reported conversion revenue from Meta Ads, Google Ads, and GA4 simultaneously in a single formula.
- Exact Solution: Never sum ad network conversion values together. Use GA4 or store backend revenue as your sole revenue metric, using ad networks strictly for Cost data.
- Problem 3: Looker Studio “GA4 Data API Quota Exceeded” Error
- Root Cause: Making too many concurrent live requests to GA4 from complex dashboard controls or high traffic views.
- Exact Solution: Replace direct GA4 live connections with an Extract Data connector updated daily at 2:00 AM, or route raw data through Google BigQuery.
- Problem 4: Currency Discrepancies Across Multi-Channel Scorecards
- Root Cause: Meta Ads account billed in EUR while Google Ads and GA4 report in USD.
- Exact Solution: Add a calculated currency conversion multiplier field in the underlying Meta dataset (e.g., Amount Spent * 1.08) prior to blending.
- Problem 5: Chart Calculations Breaking When Spend is Zero
- Root Cause: Standard division math breaks when dividing by zero or null values on non-spending days.
- Exact Solution: Wrap cost variables in IFNULL() or NCLOB() functions within your calculated field formulas (e.g., IFNULL(Cost, 0)).
Conclusion Turn Data Chaos into Strategic Growth
A cluttered, slow Looker Studio report creates confusion and leads to poor budget decisions. Rebuilding your reporting setup around a clean visual hierarchy, integrating multi-channel ad spend against single-source store revenue, and implementing scheduled Data Extracts transforms your dashboard into a fast, accurate decision-making tool.
By routing tracking pings through server-side tracking services hosted on Stape Global Hosting or Stape European Hosting, and enforcing privacy compliance via Cookiebot CMP, you ensure your Looker Studio dashboard remains accurate, fast, and reliable.
Summary by MD Niamul
Redesigning a Looker Studio dashboard resolves 25-second load delays and conflicting ad network ROAS metrics. By establishing a 3-zone visual hierarchy, blending multi-channel ad spend (Google Ads, Meta Ads) against single-source store revenue (GA4, CRM), and building custom calculated fields, you gain unvarnished visibility into cross-platform performance. Replacing live API pings with scheduled Data Extracts delivers sub-second speeds and eliminates GA4 quota crashes.
1.Why is my Looker Studio dashboard loading so slowly?
Your dashboard is likely executing heavy live API queries across multiple external platforms every time a user changes a filter. You can fix this by using Google’s native Extract Data connector, which snapshots and caches your data to deliver sub-second load times.
2.What is data blending in Looker Studio?
Data blending allows you to combine metrics and dimensions from up to 5 different data sources into a single chart using shared join keys (such as Date or Campaign ID). This makes it possible to compare Google Ads cost and Meta Ads spend against GA4 revenue in a single table.
3.How do I calculate accurate multi-channel ROAS in Looker Studio?
Calculate true multi-channel ROAS by combining ad spend from Google Ads and Meta Ads against single-source revenue from GA4 or your store CRM. Create a custom calculated field using the formula: SUM(GA4 Purchase Revenue) / (SUM(IFNULL(Google Cost, 0)) + SUM(IFNULL(Meta Spend, 0))).
4.What join type should I use for multi-channel ad blending?
Left Outer Join or Full Outer Join are the best options for multi-channel ad reporting. A Left Outer Join preserves all rows from your primary table (such as a master date table) and matches ad spend where available, preventing missing data on days with zero spend.
5.How do I avoid GA4 Data API quota limits in Looker Studio?
You can avoid GA4 API quota limits by converting live GA4 connectors into scheduled Extract Data sources or by exporting raw GA4 events to Google BigQuery and connecting BigQuery directly to Looker Studio.
6.Can I integrate CRM lead data into Looker Studio?
Yes, you can connect CRM systems like HubSpot, Salesforce, or Zoho using native connectors, Google Sheets, or third-party tools. This allows you to track metrics like Cost Per Qualified Lead (CPQL) and Customer Acquisition Cost (CAC) alongside ad spend.
7.Why does Meta Ads report higher sales than GA4?
Meta Ads uses view-through and click-through attribution windows that claim credit for sales even if a customer later clicked a Google Ad or organic link before buying. GA4 uses data-driven attribution, resulting in lower attributed sales for Meta. Blended reporting resolves this conflict.
8.How often do Looker Studio extracted data sources update?
Looker Studio Data Extracts can be scheduled to update automatically on a daily, weekly, or monthly basis. Setting a daily automatic refresh at 2:00 AM ensures your dashboard displays fresh data every morning without slowing down user queries.
9.What is the difference between data source and chart-level calculated fields?
Data source calculated fields are created within the underlying data schema and can be reused across all pages, charts, and controls in a report. Chart-level calculated fields exist only within the specific widget where they were created.
10.How does Google Consent Mode V2 affect Looker Studio reports?
Google Consent Mode V2 adjusts tag behavior based on user cookie preferences. In regions with lower consent rates, raw event counts drop, but GA4 uses machine learning to model missing conversions, which then populate into Looker Studio to maintain reporting accuracy.
 Need Help Advanced GHL Automation & Tracking Setup?