
Quick Answer
Precision GA4 reporting in Google Looker Studio requires establishing aligned event definitions, configuring custom dimensions in GA4, and connecting data sources using native connectors or BigQuery. Data mismatches between the GA4 user interface and Looker Studio stem from API quota sampling, thresholding, time-zone alignment, and API dimension scope differences. By building custom calculated fields, applying precise data filters, and blending GA4 with ad network data, you can create automated, executive-ready performance dashboards that reflect your true business metrics.
Key Takeaways
- Eliminate Data Discrepancies: Resolve mismatches between the GA4 UI and Looker Studio by matching reporting identities, time zones, and API dimension scopes.
- Register Custom Definitions First: Every custom parameter pushed via Web Google Tag Manager (GTM) must be registered as a Custom Dimension or Custom Metric in GA4 before it becomes visible in Looker Studio.
- Bypass API Quota Limits: Manage GA4 Data API token limits using report caching, extracts, or routing high-volume event data through BigQuery.
- Master Calculated Fields: Write custom formulas in Looker Studio to calculate e-commerce metrics like Net Revenue, Conversion Rate, and Average Order Value (AOV).
- Ensure Privacy Compliance: Integrate Google Consent Mode V2 using Cookiebot to ensure your reporting pipelines respect user consent signals without losing baseline analytics.
Introduction The $20,000 Analytics Discrepancy Nightmare
A few months ago, a client came to me in a panic right before a board meeting. Their e-commerce store backend showed $85,000 in monthly revenue. The standard Google Analytics 4 (GA4) Monetization report logged $82,000. However, the custom Looker Studio dashboard built by their previous marketing agency displayed $62,000.
A $20,000 data gap stood between their actual sales and their executive reporting. Because the dashboard numbers looked unreliable, the board lost confidence in the agency’s performance marketing metrics, and ad budgets were temporarily frozen.
					TRADITIONAL FLAWED REPORTING PIPELINE (DATA DISCREPANCIES)
[ User Website ] ---> [ Unfiltered GA4 Engine ] ---> [ Thresholding / API Quotas ] ---> [ Discrepant Looker Dashboard ]

PRECISION ANALYTICS PIPELINE (RESILIENT DATA FLOW)
[ User Website ] ---> [ Web GTM + Custom Listener ] ---> [ GA4 + Custom Definitions ] ---> [ Looker Studio + Calculated Fields ]
The problem was not that GA4 was broken. The issue was that native GA4 reports and Looker Studio process clickstream data differently. Native GA4 reports apply data thresholding, Google Signals identity modeling, and pre-aggregated summaries. Looker Studio queries the raw GA4 Data API directly, exposing raw dimension combinations that behave differently when aggregated.
Relying on standard GA4 exploration views for executive client reporting is like driving a race car with a dirty windshield. Looker Studio provides the clarity you need, but only if configured with precision.
In this comprehensive guide, I will walk you through building precision GA4 dashboards in Google Looker Studio, mapping custom event parameters, eliminating data discrepancies, and setting up automated client reports.
Why Native GA4 Reports Fail (And Why Looker Studio is Mandatory)
When Google transitioned from Universal Analytics to GA4, the built-in reporting interface changed fundamentally. GA4 is an event-based data collection engine rather than a traditional pre-packaged reporting tool.
Thinking of GA4’s native user interface as a full reporting suite is like comparing a standard car speedometer to an airplane dashboard. The GA4 interface offers basic exploration tables, but it lacks the customization required for high-stakes business intelligence.
The Three Core Limitations of the Native GA4 Interface
- Data Thresholding & Sampling: When Google Signals is enabled, GA4 routinely masks row data in standard reports to protect user privacy. This leaves your custom parameters marked with warning icons and missing numbers.
- Rigid Dashboard Customization: The standard GA4 “Reports” section lacks flexibility for custom layouts, branding, calculated formulas, or automated scheduled emails for stakeholders.
- Isolated Platform Silos: Native GA4 reports cannot natively blend your analytics data alongside ad performance metrics from platforms like Meta Ads, Google Ads, or Shopify store backends within a single unified view.
5 Strategic Benefits of Building Looker Studio Dashboards
- Single Source of Truth: Unify GA4 web performance, paid ad spend, and CRM conversion metrics inside one interactive dashboard.
- Real-Time Data Transparency: Access raw event and custom metric dimensions directly via the GA4 API, bypassing UI interface thresholding.
- Custom Metric Formulas: Calculate custom performance indicators—such as true Return On Ad Spend (ROAS), Lead Conversion Rate, and Profit Margins—using calculated fields.
- Automated Client Reporting: Schedule automated PDF exports and dynamic links for executive stakeholders, eliminating manual weekly spreadsheet exports.
- Data Layer Parameter Exposure: Directly visualize custom event parameters captured via Google Tag Manager (GTM) for specific form fills, button clicks, and funnel interactions.
If you are running specialized platforms, explore our dedicated guides for Shopify server-side tracking setups and ecommerce server-side tracking services.
Prerequisites & Infrastructure Checklist
Before connecting your GA4 data source to Looker Studio, gather the required access permissions and system tools:
- GA4 Property: Viewer / Analyst or Administrator access (source of clickstream event and e-commerce data).
- Google Tag Manager: Publish / Edit access (deploying custom listeners, data layer tags, and GA4 event tags).
- Google Looker Studio: Creator / Edit access (building custom dashboards, calculated fields, and data blends).
- Cookiebot CMP Account: Account Admin access (managing Google Consent Mode V2 and privacy preferences).
- Stape Server Hosting: Optional account access for server-side routing via Stape Global Hosting or Stape European Hosting.
Step-by-Step Video Tutorial
Prefer following along visually while building your dashboard? Watch my video tutorial covering GA4 Looker Studio setup, parameter mapping, and data discrepancy fixes:
Step-by-Step Implementation Guide
					                     PRECISION ANALYTICS DATA PIPELINE

[ User Interactions ] ---> [ GTM Custom JS Listener ] ---> [ Data Layer Push ]
                                                                 |
                                                                 v
[ Looker Studio Dashboard ] <--- [ Custom Definitions ] <--- [ GA4 Event Tag ]
Phase 1: Custom Event & Parameter Setup via Web GTM
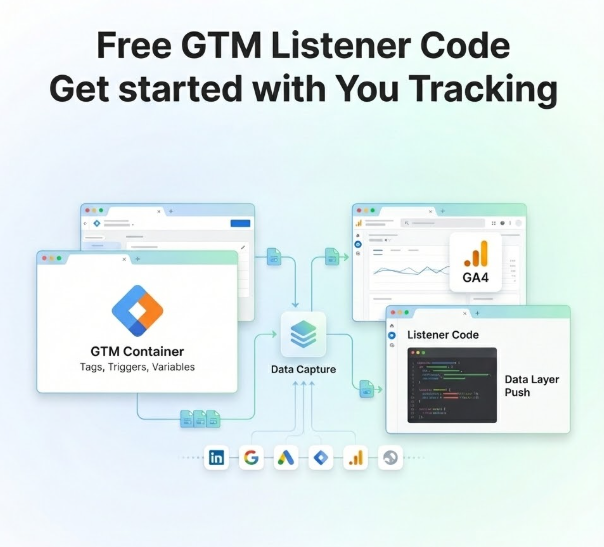
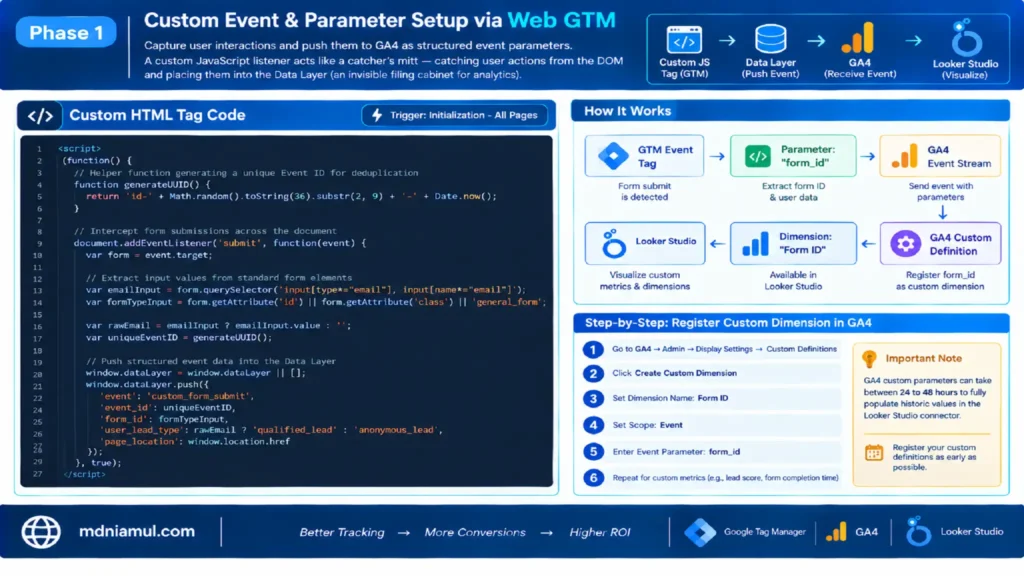
Before you can visualize custom metrics in Looker Studio, your website must capture user interactions and push them to GA4 as structured event parameters. When native GTM triggers fail to capture complex forms or dynamic actions, a custom JavaScript listener acts like a catcher’s mitt—catching user actions from the DOM and placing them into the Data Layer (an invisible filing cabinet for analytics).
Add the following production-ready JavaScript code inside a Custom HTML Tag in your Web GTM container. Set the firing trigger to Initialization – All Pages:
					<script>
(function() {
  // Helper function generating a unique Event ID for deduplication
  function generateUUID() {
    return 'id-' + Math.random().toString(36).substr(2, 9) + '-' + Date.now();
  }

  // Intercept form submissions across the document
  document.addEventListener('submit', function(event) {
    var form = event.target;

    // Extract input values from standard form elements
    var emailInput = form.querySelector('input[type="email"], input[name*="email"]');
    var formTypeInput = form.getAttribute('id') || form.getAttribute('class') || 'general_form';

    var rawEmail = emailInput ? emailInput.value : '';
    var uniqueEventID = generateUUID();

    // Push structured event data into the Data Layer
    window.dataLayer = window.dataLayer || [];
    window.dataLayer.push({
      'event': 'custom_form_submit',
      'event_id': uniqueEventID,
      'form_id': formTypeInput,
      'user_lead_type': rawEmail ? 'qualified_lead' : 'anonymous_lead',
      'page_location': window.location.href
    });
  }, true);
})();
</script>
Code Mechanics Explained
- Lines 3 to 5 (generateUUID): Creates a unique string for each submission. Passing this value ensures every event carries a unique identifier.
- Line 8 (document.addEventListener): Listens for form submit actions across your website without disrupting form navigation.
- Lines 12 to 16 (querySelector & extraction): Scans the submitted form to extract the form ID and determine if an email address was provided.
- Lines 19 to 27 (dataLayer.push): Formats custom variables—form_id and user_lead_type—and pushes the payload to GTM.
For custom form integrations, review our technical setups for HubSpot Form Conversion Tracking Services and GoHighLevel Form Conversion Tracking Services.
Phase 2: Registering GA4 Custom Definitions
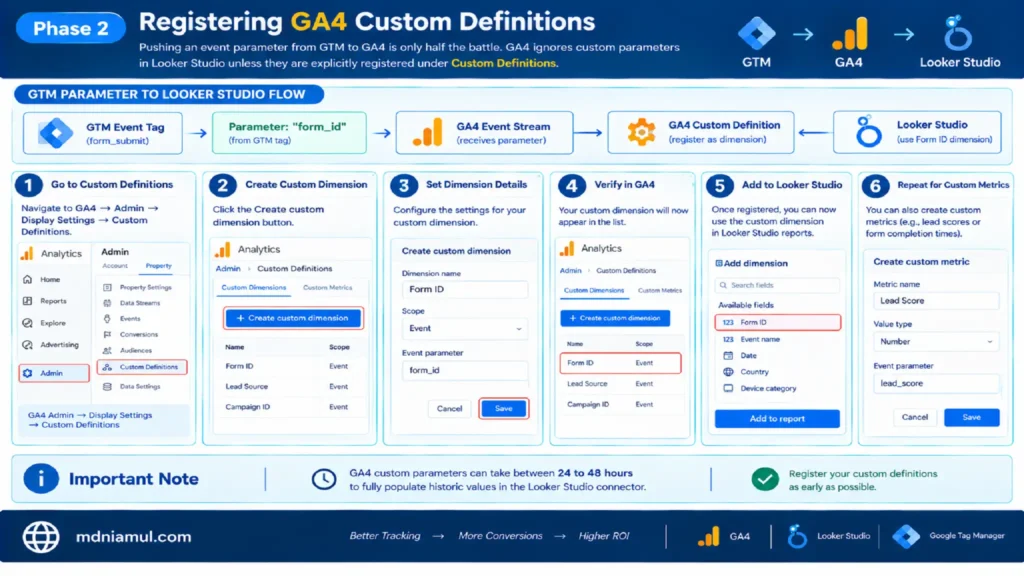
Pushing an event parameter from GTM to GA4 is only half the battle. GA4 ignores custom parameters in Looker Studio unless they are explicitly registered under Custom Definitions.
              GTM PARAMETER TO LOOKER STUDIO FLOW

[ GTM Event Tag ] ---> [ Parameter: "form_id" ] ---> [ GA4 Event Stream ]
                                                           |
                                                           v
[ Looker Studio ] <--- [ Dimension: "Form ID" ] <--- [ GA4 Custom Definition ]
- Navigate to GA4 -> Admin -> Display Settings -> Custom Definitions.
- Click Create Custom Dimension.
- Set the Dimension Name to Form ID.
- Set the Scope to Event.
- Enter the exact Event Parameter key matching your GTM tag: form_id.
- Repeat the process for custom metrics (e.g., custom lead scores or form completion times).
Important Note: GA4 custom parameters can take between 24 to 48 hours to fully populate historic values in the Looker Studio connector. Register your custom definitions as early as possible.
Phase 3: Connecting GA4 to Looker Studio & Preventing API Quota Limits
To connect GA4 to Looker Studio:
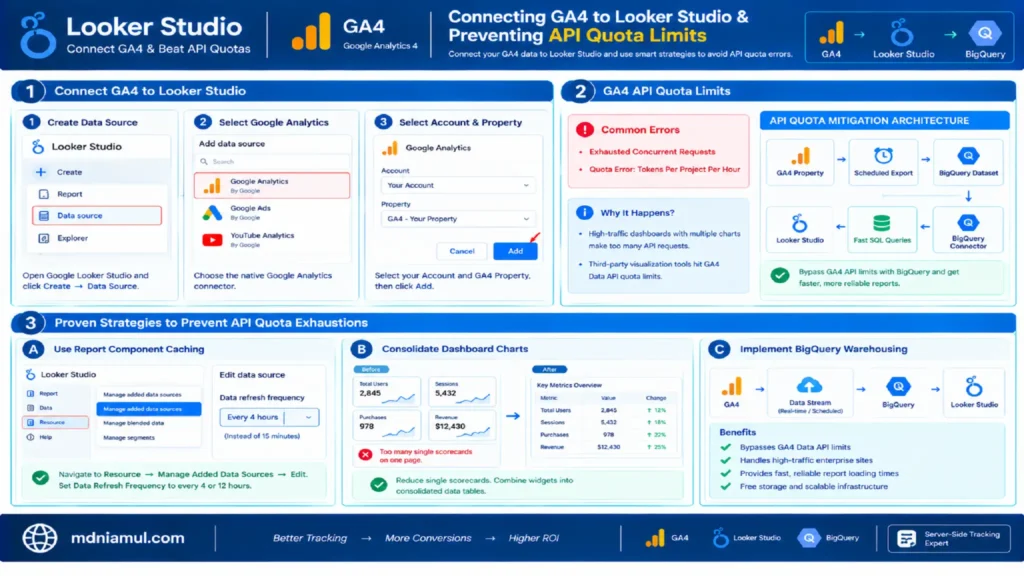
- Open Google Looker Studio and click Create -> Data Source.
- Select the native Google Analytics connector.
- Select your Account and GA4 Property, then click Add.
Managing GA4 API Quota Limits
Google enforces strict GA4 Data API Quota Limits on concurrent requests made by third-party visualization tools. High-traffic dashboards with multiple charts can trigger quota errors like Exhausted Concurrent Requests or Quota Error: Tokens Per Project Per Hour.
                 API QUOTA MITIGATION ARCHITECTURE

[ GA4 Property ] ---> [ Scheduled Export ] ---> [ BigQuery Dataset ]
                                                        |
                                                        v
[ Looker Studio ] <--- [ Fast SQL Queries ] <--- [ BigQuery Connector ]
Proven Strategies to Prevent API Quota Exhaustions
- Use Report Component Caching: In Looker Studio, navigate to Resource -> Manage Added Data Sources -> Edit. Set Data Refresh Frequency to every 4 or 12 hours instead of 15 minutes.
- Consolidate Dashboard Charts: Reduce the number of single scorecards on a single page. Combine loose widgets into consolidated data tables.
- Implement BigQuery Warehousing: For high-traffic enterprise sites, stream raw GA4 data to Google BigQuery for free, then connect Looker Studio to BigQuery. This bypasses the GA4 Data API entirely and ensures fast report loading times.
If you route data through server-side environments, check out our guide on server-side tracking services.
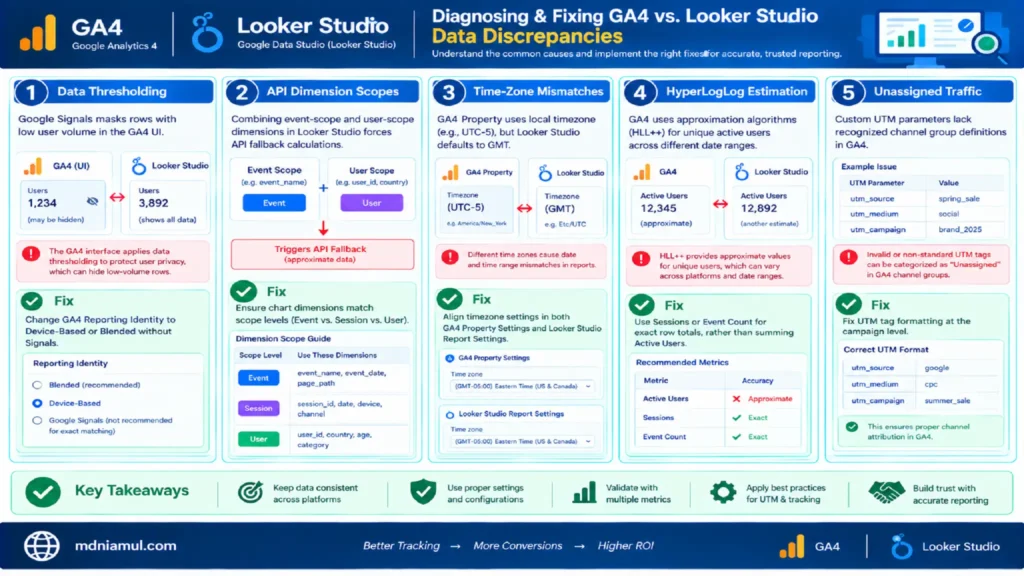
Phase 4: Diagnosing & Fixing GA4 vs. Looker Studio Data Discrepancies
When decision-makers see different numbers between the native GA4 interface and a Looker Studio report, they lose trust in the analytics system. Here is why these discrepancies happen and how to resolve them:
- Data Thresholding: Google Signals masks rows with low user volume in the GA4 UI. Fix: Change GA4 Reporting Identity to Device-Based or Blended without Signals.
- API Dimension Scopes: Combining event-scope and user-scope dimensions in Looker Studio forces API fallback calculations. Fix: Ensure chart dimensions match scope levels (Event vs. Session vs. User).
- Time-Zone Mismatches: GA4 Property uses local timezone (e.g., UTC-5), but Looker Studio defaults to GMT. Fix: Align timezone settings in GA4 Property Settings and Looker Studio Report Settings.
- HyperLogLog Estimation: GA4 uses approximation algorithms (HLL++) for unique active users across different date ranges. Fix: Use Sessions or Event Count for exact row totals, rather than summing Active Users.
- Unassigned Traffic: Custom UTM parameters lack recognized channel group definitions in GA4. Fix: Fix UTM tag formatting (utm_source, utm_medium, utm_campaign) at the campaign level.
Phase 5: Building Custom Calculated Fields, Metrics & Data Blending
Raw metrics rarely tell the whole story. Looker Studio allows you to create calculated fields to extract actionable business insights.
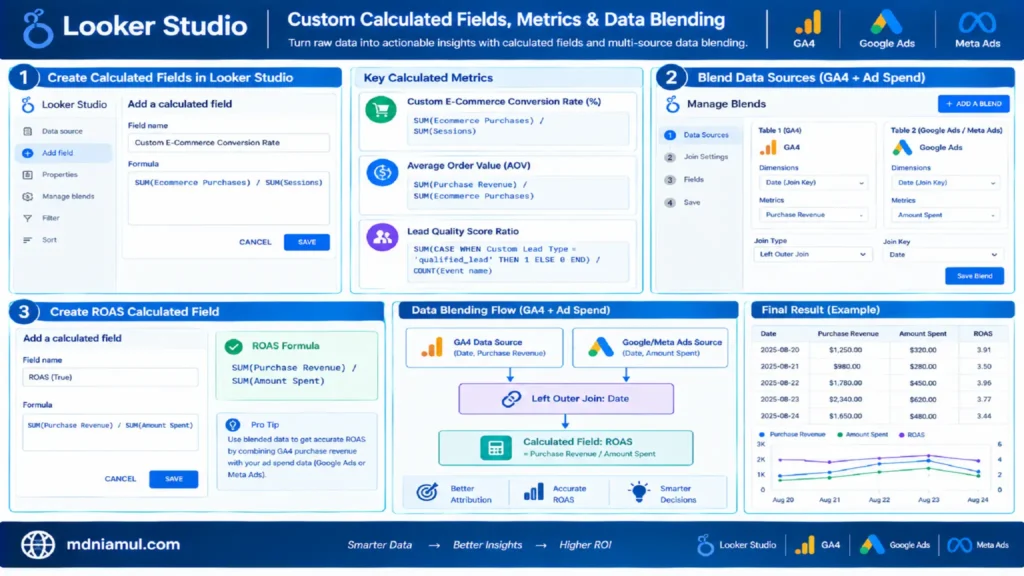
1. Formulating Key Calculated Metrics
In Looker Studio, open your data source and click Add Field. Use these formulas for common e-commerce performance indicators:
- Custom E-Commerce Conversion Rate (%):
SUM(Ecommerce Purchases) / SUM(Sessions)
- Average Order Value (AOV):
SUM(Purchase Revenue) / SUM(Ecommerce Purchases)
- Lead Quality Score Ratio:
					SQL
SUM(CASE WHEN Custom Lead Type = 'qualified_lead' THEN 1 ELSE 0 END) / COUNT(Event name)
2. Blending Data Sources (GA4 + Ad Spend)
To calculate true Return On Ad Spend (ROAS), you must blend GA4 purchase revenue with cost data from Meta Ads or Google Ads:
- Click Manage Blends -> Add a Blend.
- Set Table 1 to your GA4 Data Source. Include Date as the Join Key, and Purchase Revenue as the Metric.
- Set Table 2 to your Google Ads or Meta Ads Data Source. Include Date as the Join Key, and Amount Spent as the Metric.
- Configure a Left Outer Join on Date.
- Save the blend and create a calculated field:
SUM(Purchase Revenue) / SUM(Amount Spent)
					console.log( 'Code is Poetry' );
                    LOOKER STUDIO DATA BLENDING

[ GA4 Data Source ]       [ Google/Meta Ads Source ]
(Date, Purchase Revenue)   (Date, Amount Spent)
          |                         |
          +------------+------------+
                       |
                       v
             [ Left Outer Join: Date ]
                       |
                       v
         [ Calculated Field: ROAS ]
         = Purchase Revenue / Amount Spent
For specialized offline funnel attribution, explore our guide on offline conversion tracking services.
Phase 6: Privacy Compliance & Google Consent Mode V2 via Cookiebot
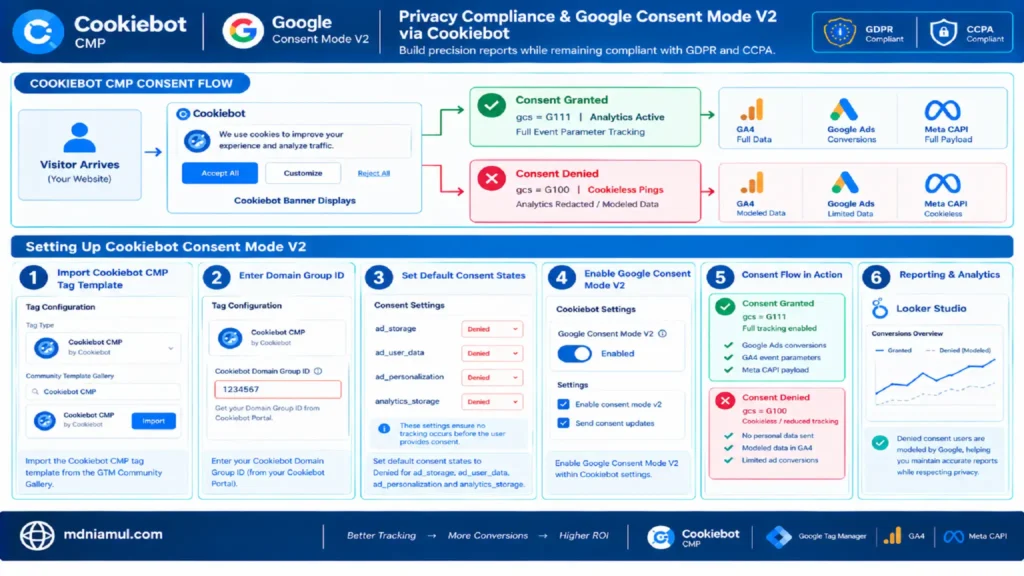
To build precision reports while remaining compliant with GDPR and CCPA, integrate Cookiebot CMP alongside Google Consent Mode V2.
                 COOKIEBOT CMP CONSENT FLOW

[ Visitor Arrives ] ---> [ Cookiebot Banner Displays ]
                                   |
         +-------------------------+-------------------------+
         | (Consent Granted)                                 | (Consent Denied)
         v                                                   v
[ gcs = G111 | Analytics Active ]             [ gcs = G100 | Cookieless Pings ]
  Full Event Parameter Tracking                 Analytics Redacted / Modeled Data
Setting Up Cookiebot Consent Mode V2
- Import the Cookiebot CMP tag template from the GTM Community Gallery.
- Enter your Cookiebot Domain Group ID (from your Cookiebot Portal).
- Set default consent states to Denied for ad_storage, ad_user_data, ad_personalization, and analytics_storage.
- Enable Google Consent Mode V2 within Cookiebot settings.
When consent is granted, GA4 records full event parameters. When consent is denied, GA4 sends cookieless pings, allowing Google’s AI modeling to bridge reporting gaps in your Looker Studio charts without violating user privacy.
Complete GTM & Looker Studio Data Blueprint
Web GTM Container Configuration Blueprint
- Custom HTML Tag (cJS – Form Event Listener): Fires on Initialization – All Pages. Pushes custom_form_submit event payload to the Data Layer.
- Data Layer Variable (DLV – form_id): Configured with Variable Name form_id.
- Data Layer Variable (DLV – user_lead_type): Configured with Variable Name user_lead_type.
- GA4 Event Tag (GA4 – Custom Form Event): Event Name set to form_submission. Custom parameters include form_id = {{DLV – form_id}} and user_lead_type = {{DLV – user_lead_type}}.
- Trigger (Custom Event – Form Submit): Custom Event Name set to custom_form_submit.
Looker Studio Dashboard Chart Blueprint
- Executive Scorecard: Dimensions: None. Metrics: Sessions, Ecommerce Purchases, Purchase Revenue. Custom Calculation: SUM(Purchase Revenue) / SUM(Sessions).
- Lead Funnel Table: Dimensions: Form ID, User Lead Type. Metrics: Event Count, Total Users. Filter: Include Event Name equals form_submission.
- Channel ROAS Table: Dimensions: Session Default Channel Group. Metrics: Sessions, Conversions, Blended ROAS. Data Source: Blended Source (GA4 Revenue divided by Paid Cost).
Step-by-Step Testing & Diagnostics Workflow
- Step 1: Verify GTM Event Firing.
- Open GTM Preview Mode (tagassistant.google.com). Complete a form on your site. Confirm that custom_form_submit fires and populates form_id in the Data Layer.
- Step 2: Inspect GA4 DebugView.
- Navigate to GA4 -> Admin -> DebugView. Trigger a test event and verify that your event parameters (form_id, user_lead_type) appear in the incoming payload.
- Step 3: Confirm Custom Definition Registration.
- Check GA4 -> Custom Definitions to confirm that parameter names match your GTM setup exactly.
- Step 4: Audit Looker Studio Fields.
- In Looker Studio, refresh the data source fields. Confirm that Form ID appears as a usable green dimension.
- Step 5: Compare Metric Totals.
- Run a 7-day query comparing GA4 Standard Reports, GA4 Explorations, and Looker Studio. Ensure session and purchase metrics align within a 1-2% margin.
Troubleshooting Common Setup Errors
Issue 1: Custom Parameter Shows “(not set)” in Looker Studio
- Root Cause: The parameter was not registered under GA4 Custom Definitions prior to logging events, or the GTM variable name contains typos.
- Solution: Verify parameter spelling in GTM. Ensure form_id is registered as an Event-scoped Custom Dimension in GA4 and wait 24 hours for historic data to process.
Issue 2: Looker Studio Charts Break with “Quota Error Exceeded”
- Root Cause: Too many widgets requesting real-time GA4 API tokens simultaneously on a high-traffic dashboard.
- Solution: Change Data Refresh Frequency from 15 minutes to 4 or 12 hours. Alternatively, stream raw GA4 data to BigQuery and connect Looker Studio to BigQuery.
Issue 3: E-Commerce Purchase Totals Don’t Match Backend Store Reports
- Root Cause: Missing transaction IDs, duplicate purchase events, or ad-blockers intercepting client-side GTM requests.
- Solution: Implement server-side container routing via Stape Global Hosting to capture missing purchases and enforce unique transaction_id deduplication.
Issue 4: Blended Data Sources Display Incorrect Metric Totals
- Root Cause: Mismatched Join Keys or missing values across date ranges in blended tables.
- Solution: Use Date as the primary join key and ensure cross-platform channels use standardized date formats (YYYYMMDD).
Summary by MD Niamul
Mastering precision GA4 reporting in Google Looker Studio requires establishing aligned event definitions, configuring custom dimensions, and managing your reporting architecture effectively. By deploying custom event listeners via Google Tag Manager, registering event parameters in GA4, addressing API quota limits, and resolving platform discrepancies, you can transform complex analytics into clear, actionable business dashboards. Integrating Google Consent Mode V2 ensures your analytics setup remains privacy-compliant while delivering executive-ready insights.
1.What causes data mismatches between GA4 and Looker Studio?
Data mismatches occur primarily due to API quota sampling, data thresholding caused by Google Signals, mismatched timezone settings, and differences in dimension scoping. Native GA4 reports apply internal data modeling, whereas Looker Studio queries the raw GA4 Data API directly. Aligning reporting identities and dimension scopes resolves these discrepancies.
2.How do I register custom event parameters in GA4?
To register custom parameters, navigate to GA4 Admin, select Custom Definitions under Display Settings, and click Create Custom Dimension. Enter your dimension name, set the scope to Event, and enter the exact event parameter key used in your Google Tag Manager tag.
3.How can I prevent GA4 API quota limit errors in Looker Studio?
You can prevent API quota limit errors by reducing the number of charts per dashboard page, extending report data refresh intervals to 4 or 12 hours, using extract data connectors, or streaming GA4 data to Google BigQuery and querying BigQuery directly inside Looker Studio.
4.Why are my custom dimensions displaying as "(not set)"?
Custom dimensions display as “(not set)” if the parameter key in GTM does not match the key registered in GA4, if the parameter is missing from the event payload, or if insufficient processing time (up to 24-48 hours) has passed since registering the custom definition.
5.What is the benefit of data blending in Looker Studio?
Data blending allows you to combine metrics from multiple sources—such as GA4 website analytics and paid ad spend from Meta or Google Ads—into a single table. This enables you to calculate cross-channel metrics like blended Return On Ad Spend (ROAS) and Cost Per Lead (CPL).
6.How does Google Consent Mode V2 affect Looker Studio reports?
Google Consent Mode V2 dynamically updates analytics tags based on user consent choices. When users accept cookies, full event payloads reach GA4. When consent is denied, GA4 logs cookieless pings, allowing Google’s AI modeling to fill reporting gaps in Looker Studio while respecting user privacy.
7.Can I connect Looker Studio to GA4 without BigQuery?
Yes, Looker Studio includes a native, free Google Analytics connector. This direct connection works well for small-to-medium websites. However, high-traffic enterprise sites often benefit from routing through BigQuery to prevent API quota limits and speed up report rendering.
8.How long does it take for custom parameters to show in Looker Studio?
Once registered under GA4 Custom Definitions, new custom parameters typically begin appearing in Looker Studio within 24 to 48 hours. Historical data collected before registration will not be backfilled into the custom dimension.
9.What is the difference between Event, Session, and User scopes in GA4?
Event scope applies to specific user actions (like a button click). Session scope attributes actions to a single visit session. User scope attaches parameters to a visitor across all past and future visits. Combining different scopes within a single Looker Studio table can cause reporting errors.
10.How do I share Looker Studio dashboards securely with clients?
Looker Studio allows you to share dashboards via direct email access, view-only links, or scheduled automated PDF reports. You can also restrict viewer permissions, preventing users from modifying underlying data sources or calculated formulas.
 Need Help Advanced GHL Automation & Tracking Setup?